You are here: Foswiki>SubExp_Chalmers Web>AnglesProtonsEmited (14 Nov 2023, IsabellaTepp)Edit Attach
-- IsabellaTepp - 14 Nov 2023
--test-13=dz=0.01cm,z0=${DIST}cm,r=1.2cm,type=blackhole,enter,tree=1 \
--gun=d,dummy,T=0MeV,setboost,feed=target \
--gun=from=target,Ac229,dummy,T/u=8MeV/u,addboost,feed=cm \
-- gun=from=cm,p,Ac230:dummy:feed:setboost,Eexc=${Ex}MeV,recoil,phasespace,isotropic,feed=compound \
--gun-file=maxparticles=80,gun_230Ac_${Ex}MeV.txt,from=compound,boost \
--world=type=vacuum \
--fieldbox=d=200cm,Bz=${B}T \
--events=100000 \
--tree=helioscylinder${DIST}cm_${Ex}Mev.root Where the test-13-object is a ''blackhole''-screen to absorb all the hits detected at the start of the detector. DIST in this case is the distance from the detector to the target and thiis parameter has been varied between 1.5, 2.0 and 2.5 cm. The excitation energy varied between 6, 7, 8, 9 and 10 MeV.
total++
} if(TST01inpdg[i] == 2212){
events++
}
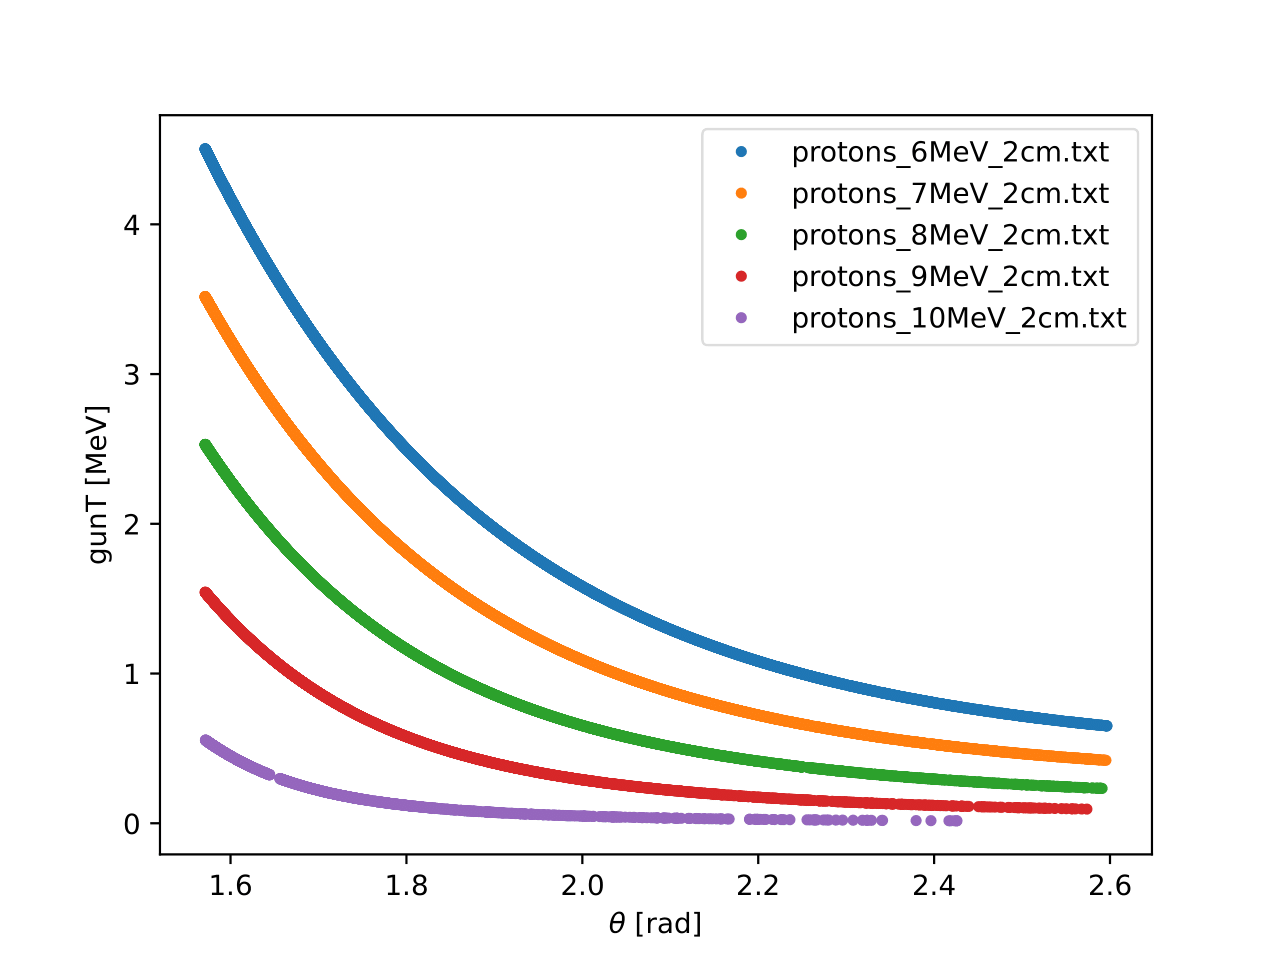
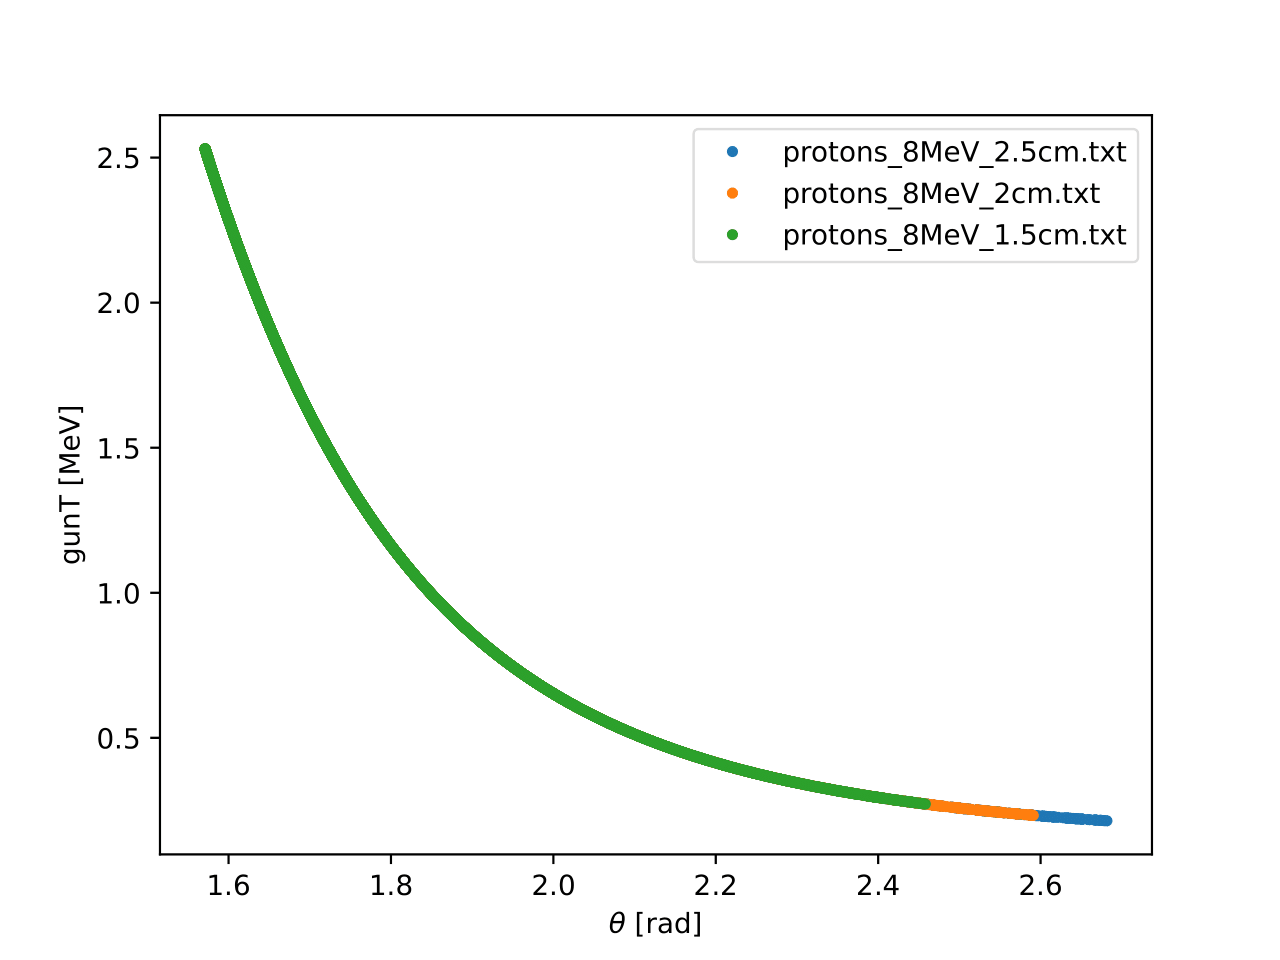
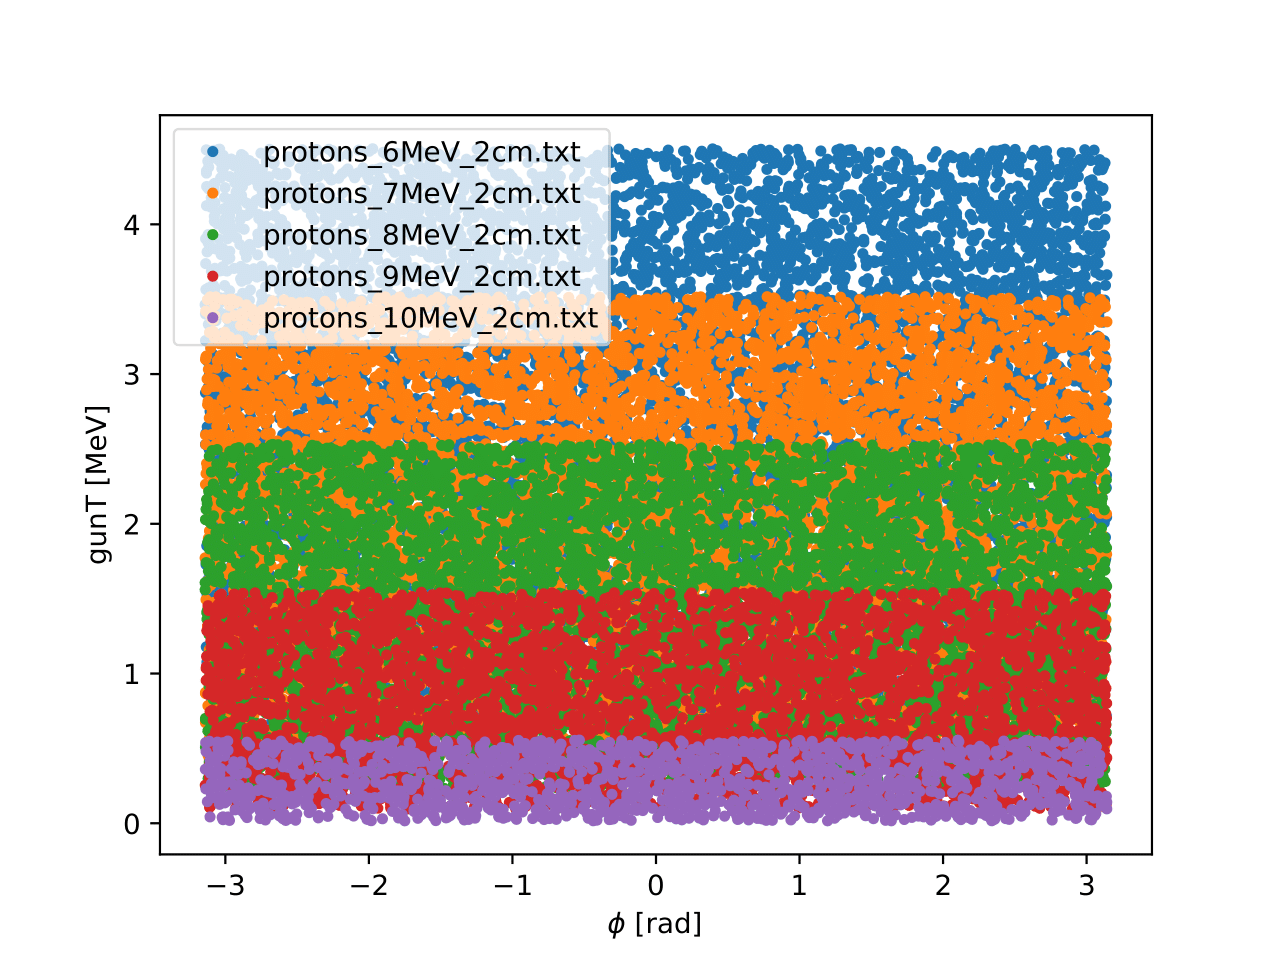
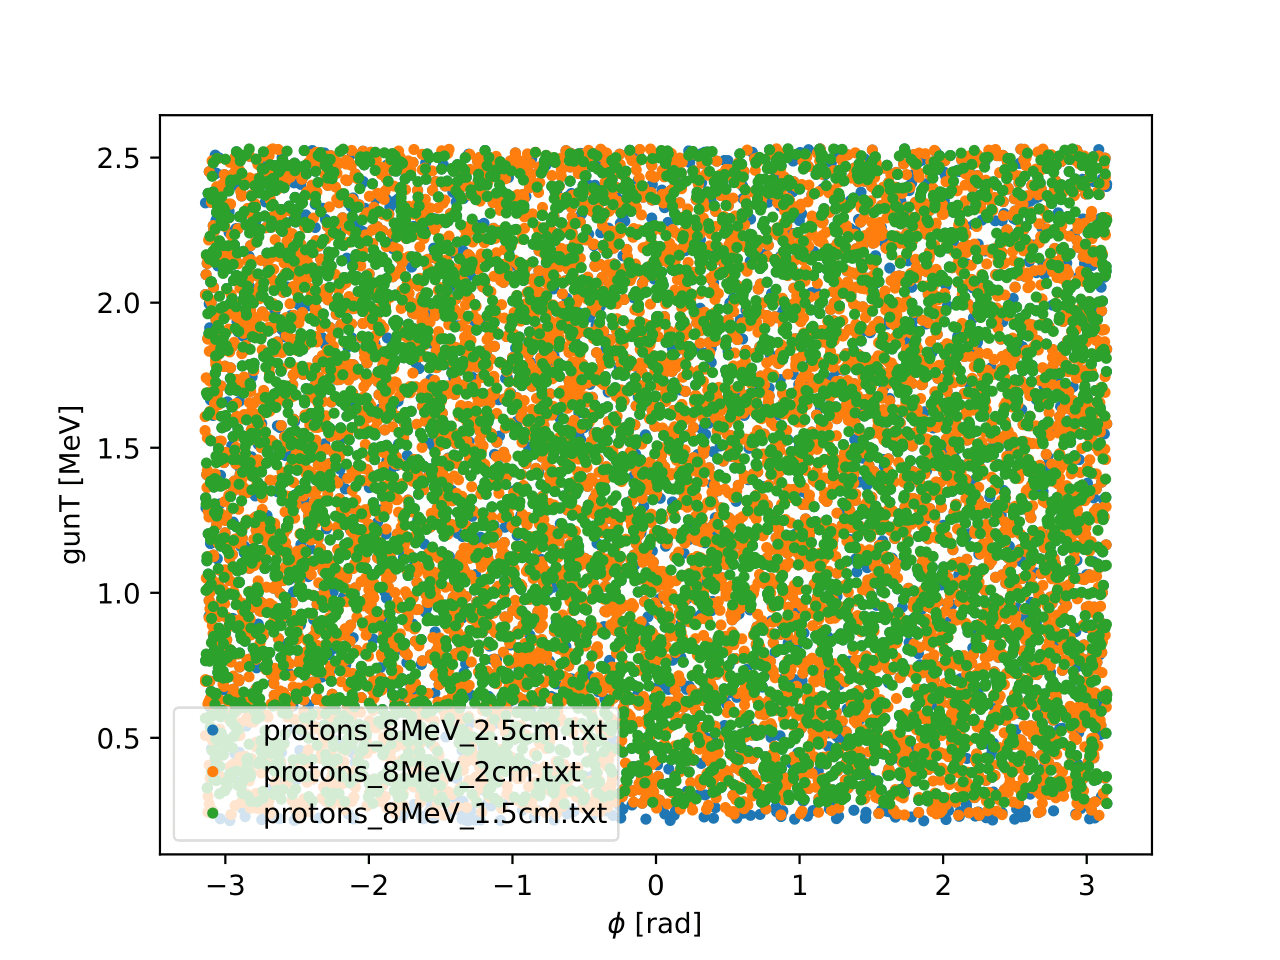
Below follows some figures with the energy of the protons plotted against angles (both θ and the azimuthal angle φ).


 The total kinetic energy of the protons plotted against φ for simulations with different distance from target to the Si-detector.
In ggland the Si-detector has been simulated as a cylinder (test-01) with the following bash-script:
--test-01=dz=36cm,z0=$((DIST-18))cm,ir=0.8cm,r=1.2cm,type=Si,enter,tree=1 \--test-13=dz=0.01cm,z0=${DIST}cm,r=1.2cm,type=blackhole,enter,tree=1 \
--gun=d,dummy,T=0MeV,setboost,feed=target \
--gun=from=target,Ac229,dummy,T/u=8MeV/u,addboost,feed=cm \
-- gun=from=cm,p,Ac230:dummy:feed:setboost,Eexc=${Ex}MeV,recoil,phasespace,isotropic,feed=compound \
--gun-file=maxparticles=80,gun_230Ac_${Ex}MeV.txt,from=compound,boost \
--world=type=vacuum \
--fieldbox=d=200cm,Bz=${B}T \
--events=100000 \
--tree=helioscylinder${DIST}cm_${Ex}Mev.root Where the test-13-object is a ''blackhole''-screen to absorb all the hits detected at the start of the detector. DIST in this case is the distance from the detector to the target and thiis parameter has been varied between 1.5, 2.0 and 2.5 cm. The excitation energy varied between 6, 7, 8, 9 and 10 MeV.
The ratio of detected protons to emitted ones have been calculated by:
if(gunpdg[i] == 2212){total++
} if(TST01inpdg[i] == 2212){
events++
}
ratio = events/total;
| DIST [cm] | Ratio [%] |
| 1.5 | 13.6 |
| 2.0 | 18.6 |
| 2.5 | 24.6 |
| Ex [MeV] | Ratio [%] |
| 6 | 27 |
| 7 | 23 |
| 8 | 19 |
| 9 | 13 |
| 10 | 5.1 |

The total kinetic energy of the protons plotted against θ for simulations with different excitation energy for the fissioning nucleus.

The total kinetic energy of the protons plotted against θ for simulations with different distance from target to the Si-detector.

The total kinetic energy of the protons plotted against φ for simulations with different excitation energy for the fissioning nucleus.
 The total kinetic energy of the protons plotted against φ for simulations with different distance from target to the Si-detector.
Edit | Attach | Print version | History: r1 | Backlinks | View wiki text | Edit wiki text | More topic actions
Topic revision: r1 - 14 Nov 2023, IsabellaTepp
 Copyright © by the contributing authors. All material on this collaboration platform is the property of the contributing authors.
 Ideas, requests, problems regarding Foswiki? Send feedback
