You are here: Foswiki>SubExp_Chalmers Web>Mean_gamma (21 Dec 2023, AnnaKawecka)Edit Attach
-- IsabellaTepp - 29 Nov 2023
 where count will then be the the number of gammas for one event. The number waswritten into a file and then plotted as histograms below.
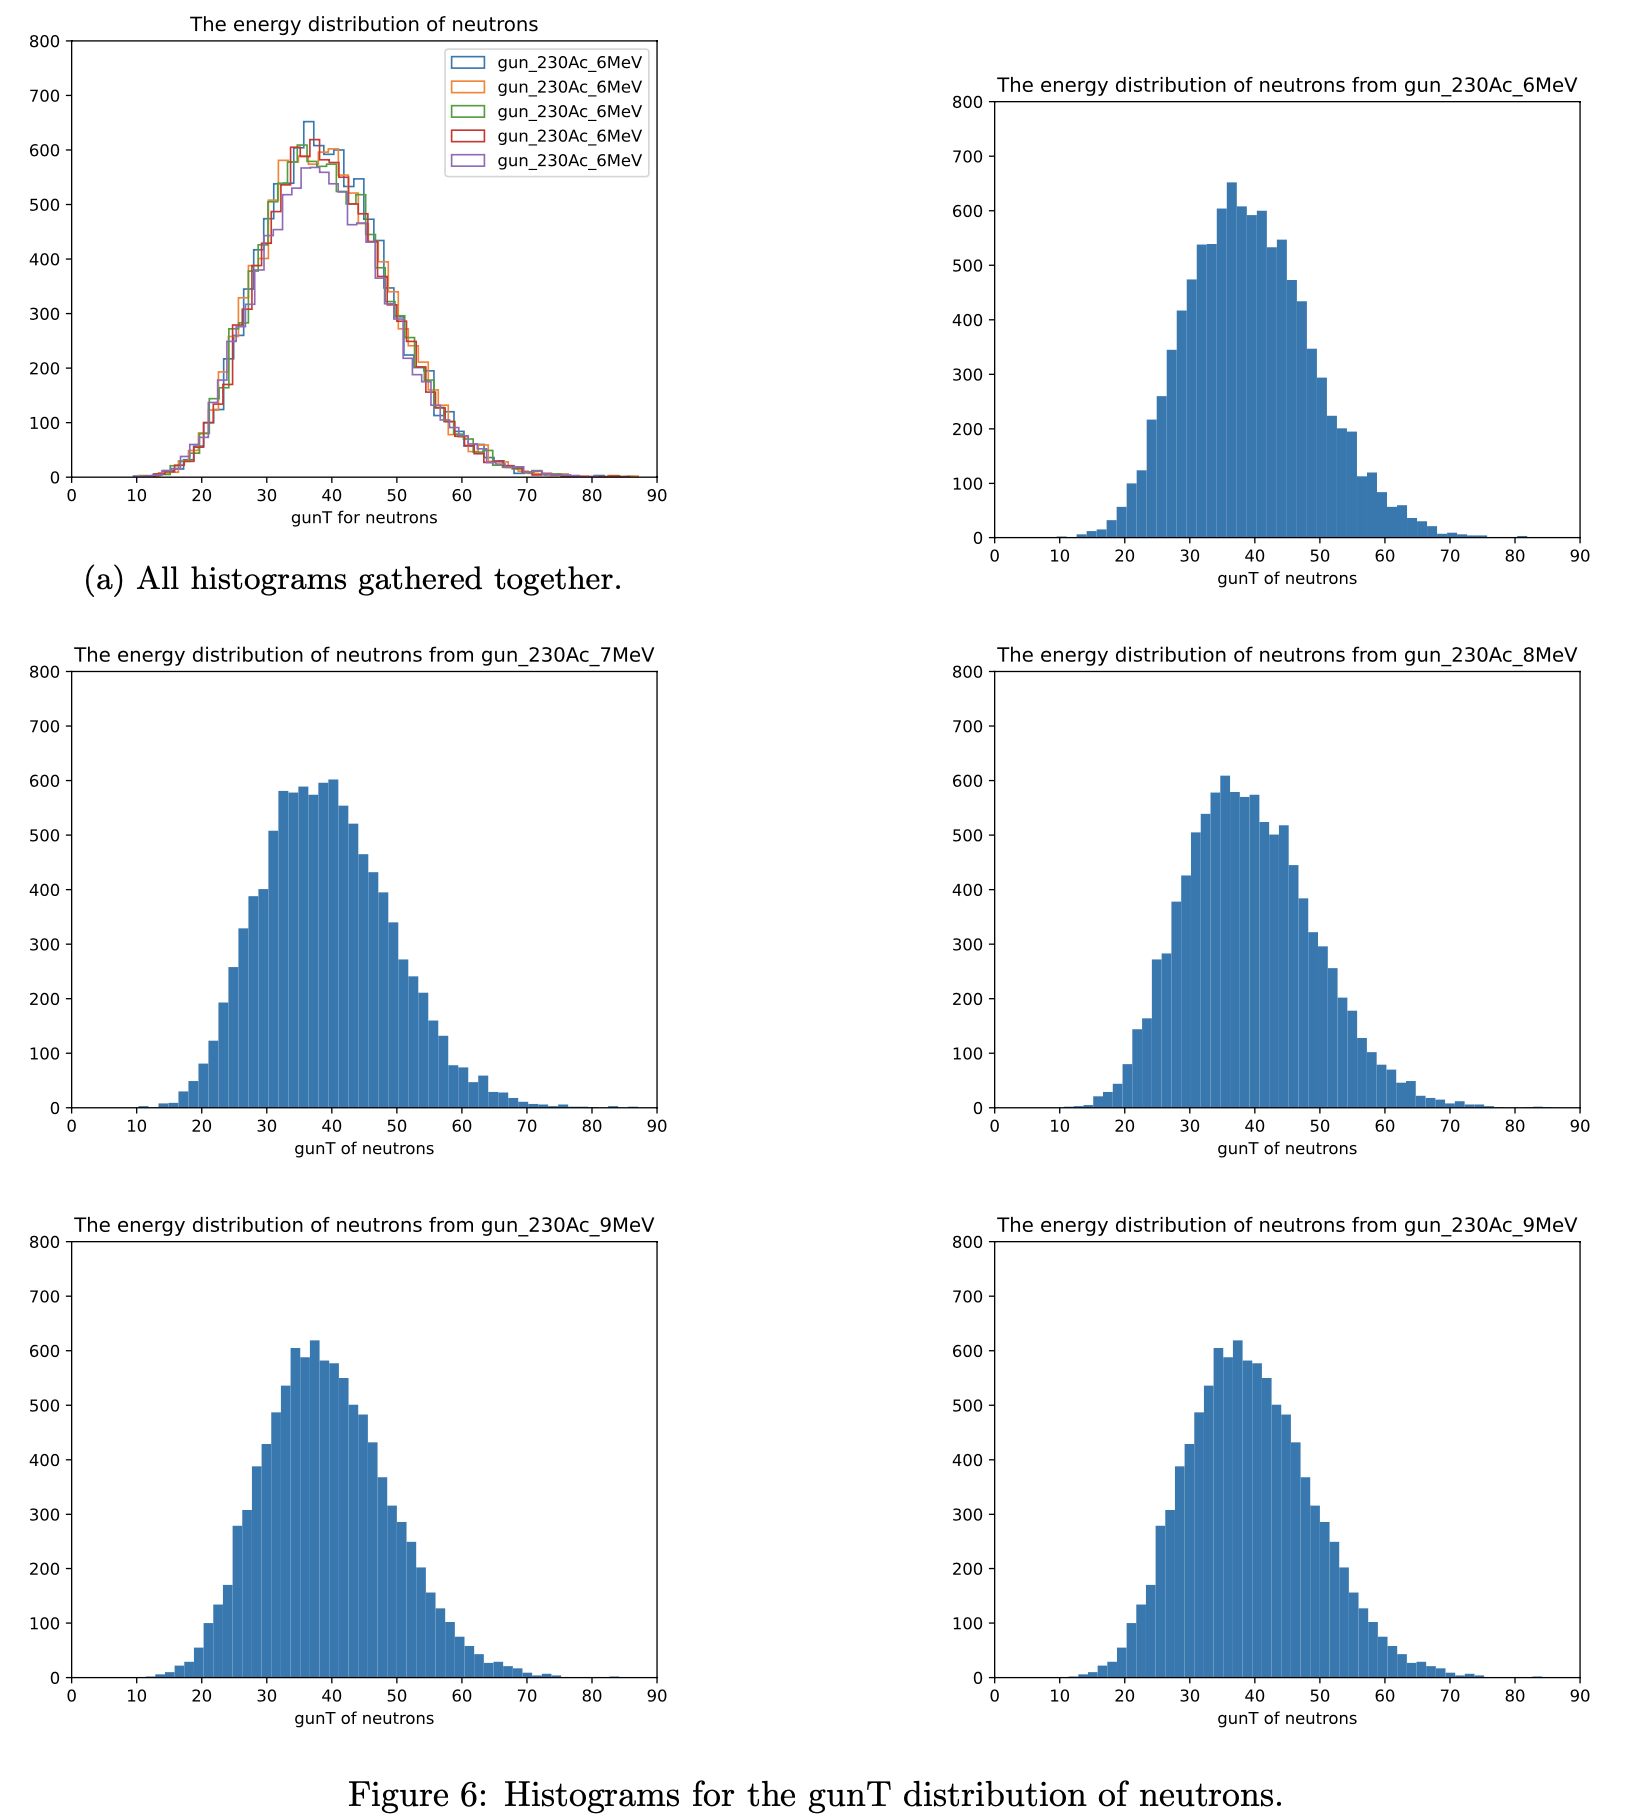
 Below are the histograms for the energy distribution of neutrons. We can see that unlike for the gammas the neutrons seem to be distribution gaussian-like around gunT~40 MeV.
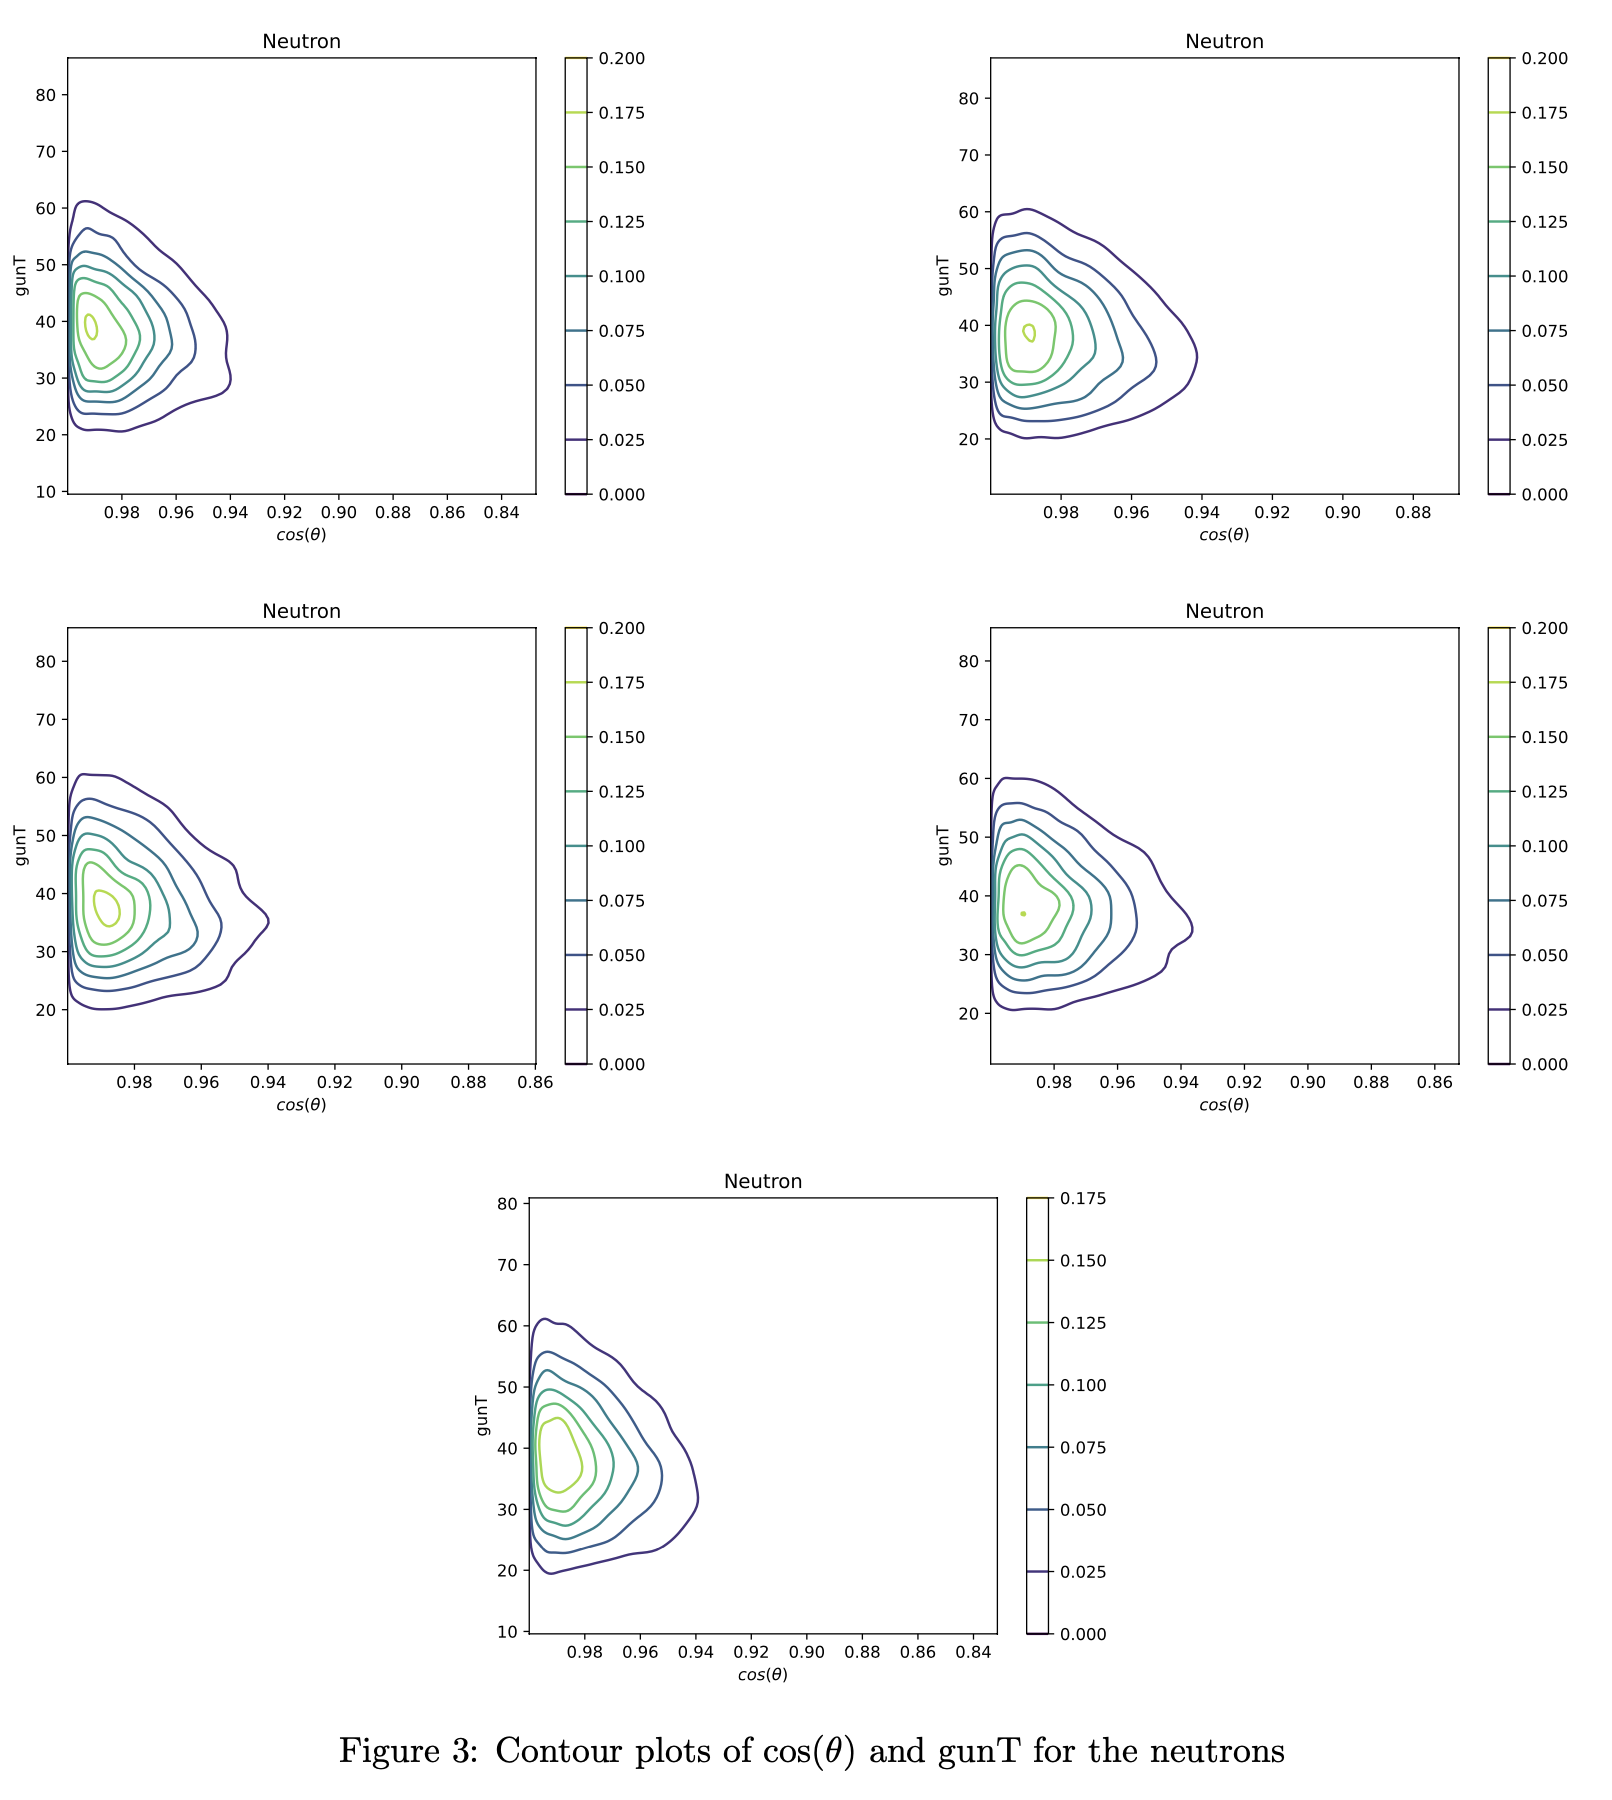
 Below follows contour plots for cos(θ) against gunT for neutrons. As expected from the energy distribution histogrrams most of the neutrons are around gunT ~40 MeV and note that the x-axis values vary very little which means neutrons are emitted at roughly the same angle cos(θ) = [0.95, 1] -→ θ ~ 0 deg
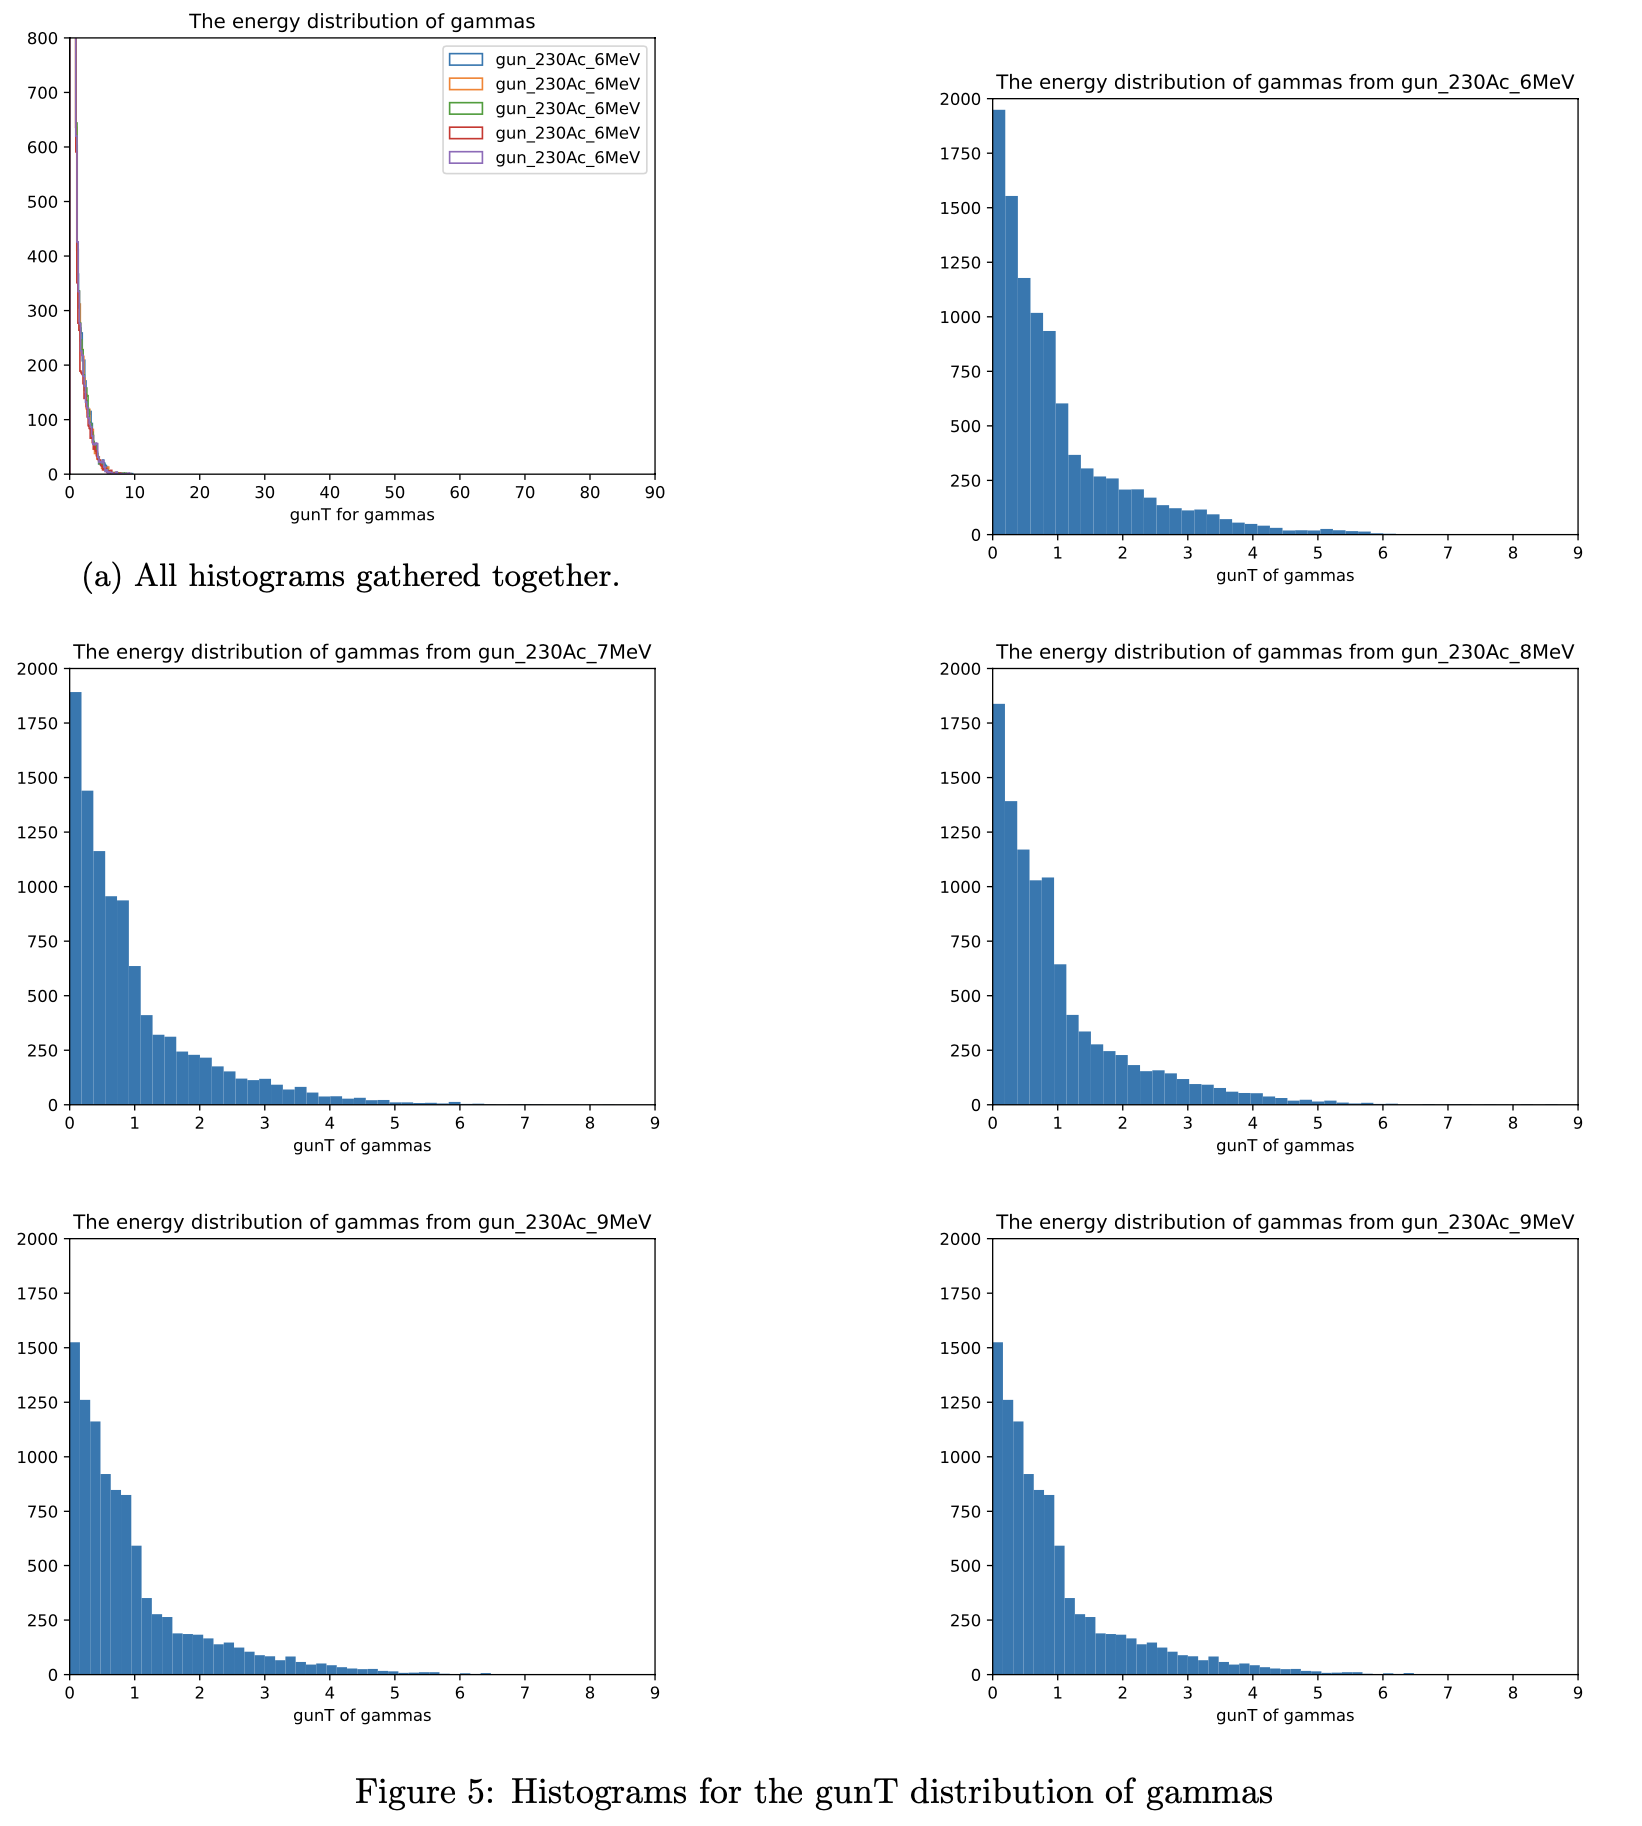
For 100 000 simulated events data for both gammas and neutrons were saved. (only 10 000 points were plotted because the files were too large)
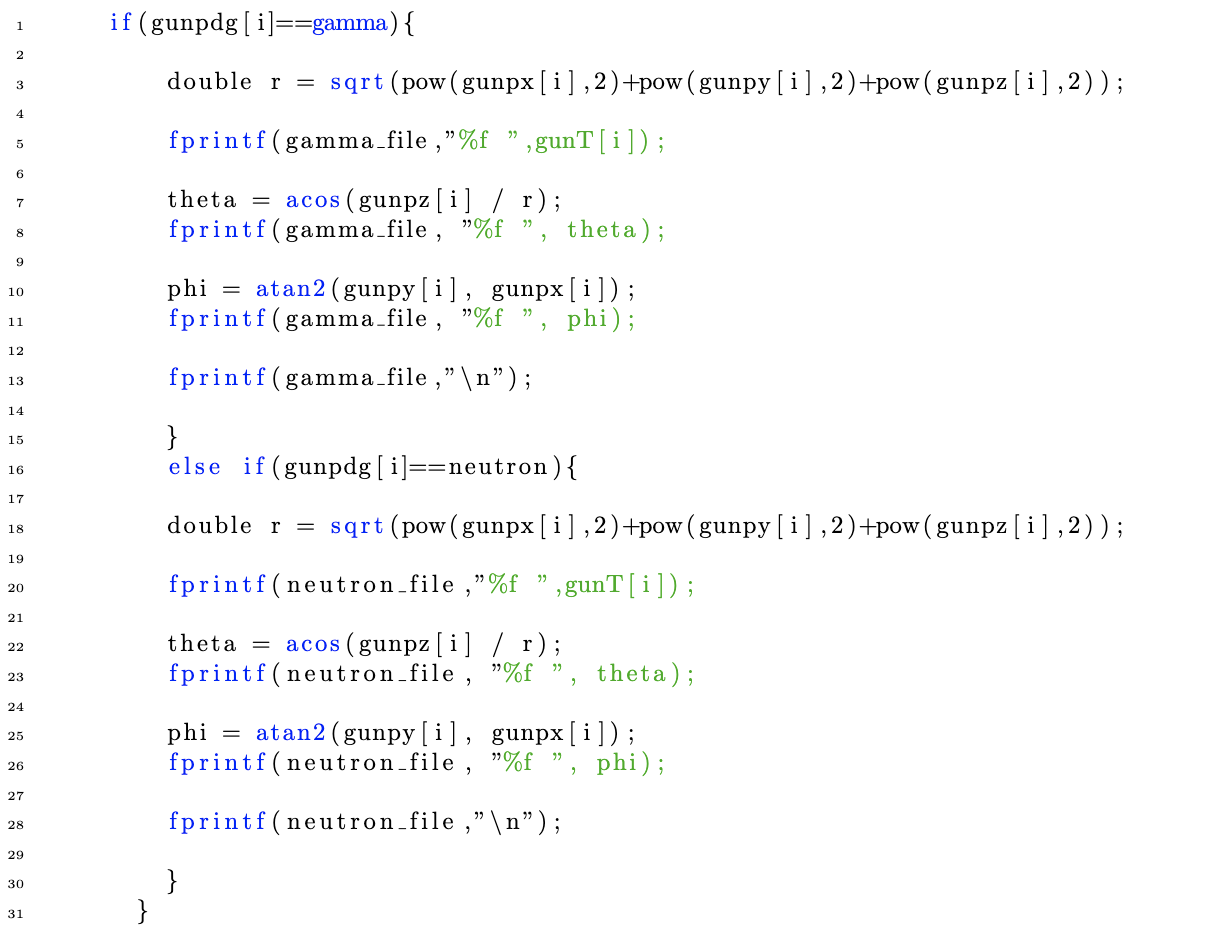
Angles were calculated as
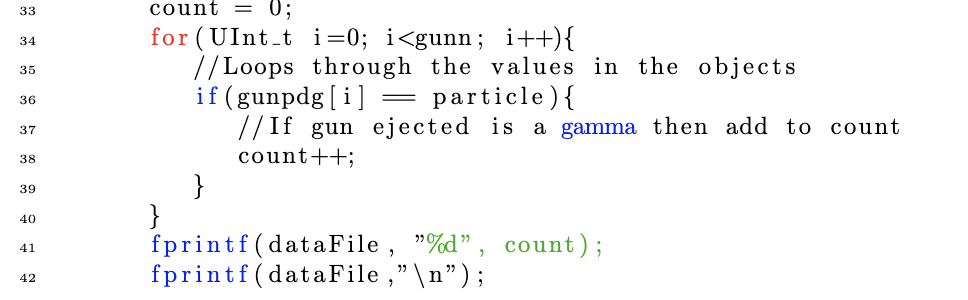
and the counts for mean gamma multiplicity were calculated as
where count will then be the the number of gammas for one event. The number waswritten into a file and then plotted as histograms below.
The same was done for neutrons as well.
Below is the histograms for the energy distribution of gammas. We can see that most gammas have a low gunT.
Below are the histograms for the energy distribution of neutrons. We can see that unlike for the gammas the neutrons seem to be distribution gaussian-like around gunT~40 MeV.
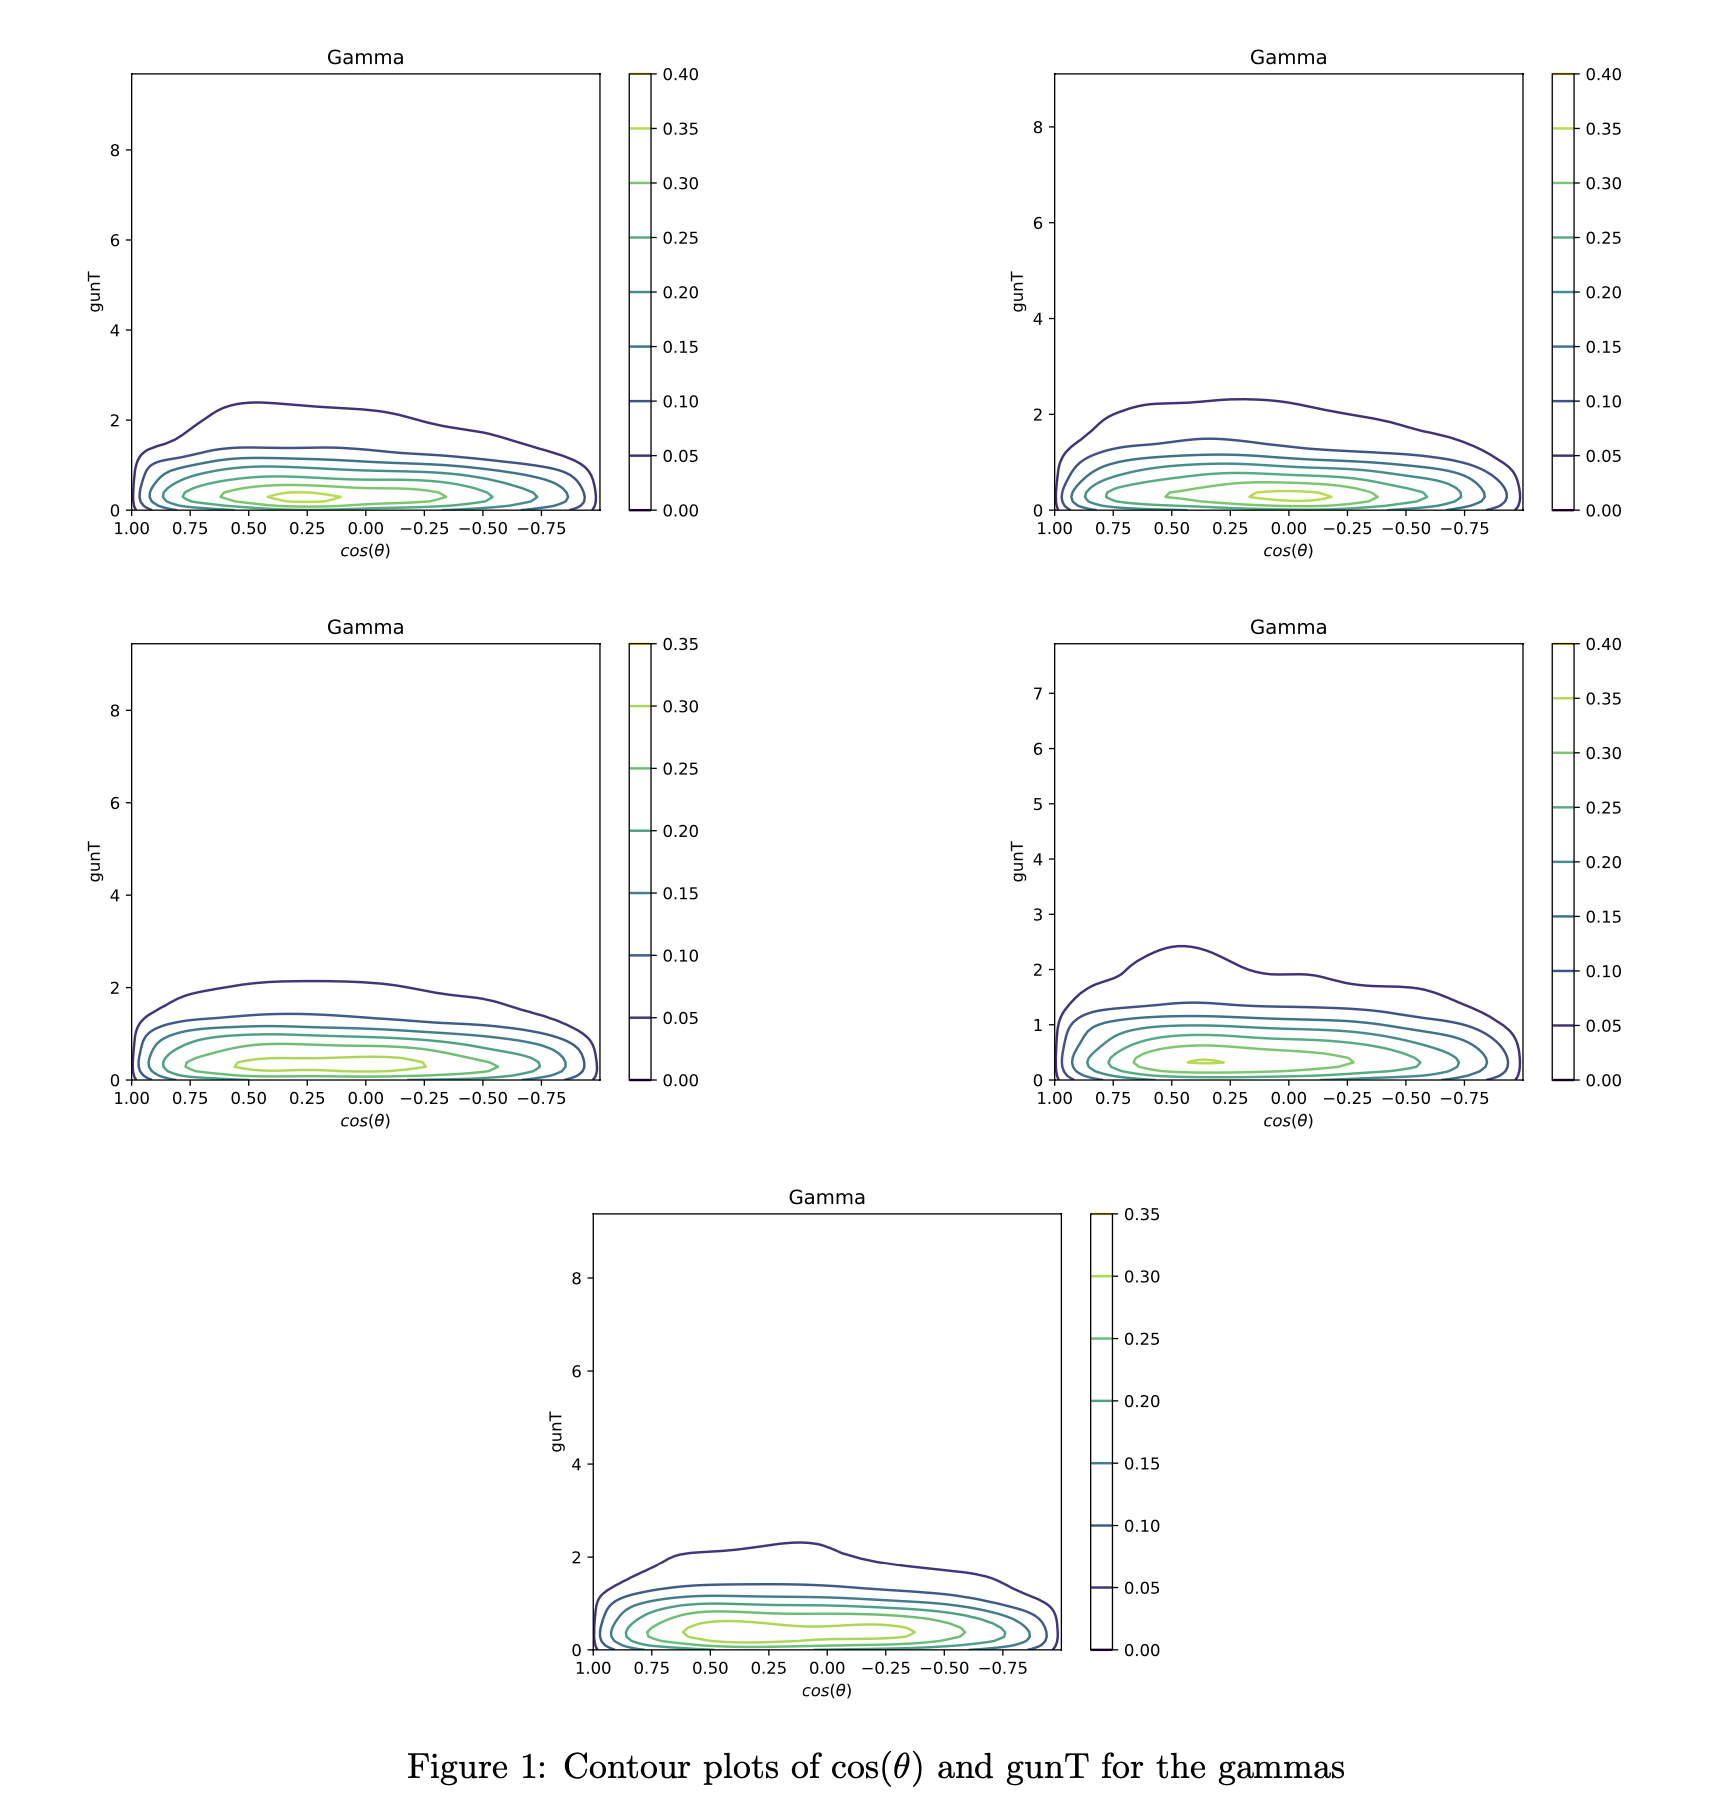
Below follows contour plots of cos(θ) and gunT for gammas. We can note a slight shift to the left in the plots for some plots, i.e. gammas are slightly more likely to have smaller values of θ.
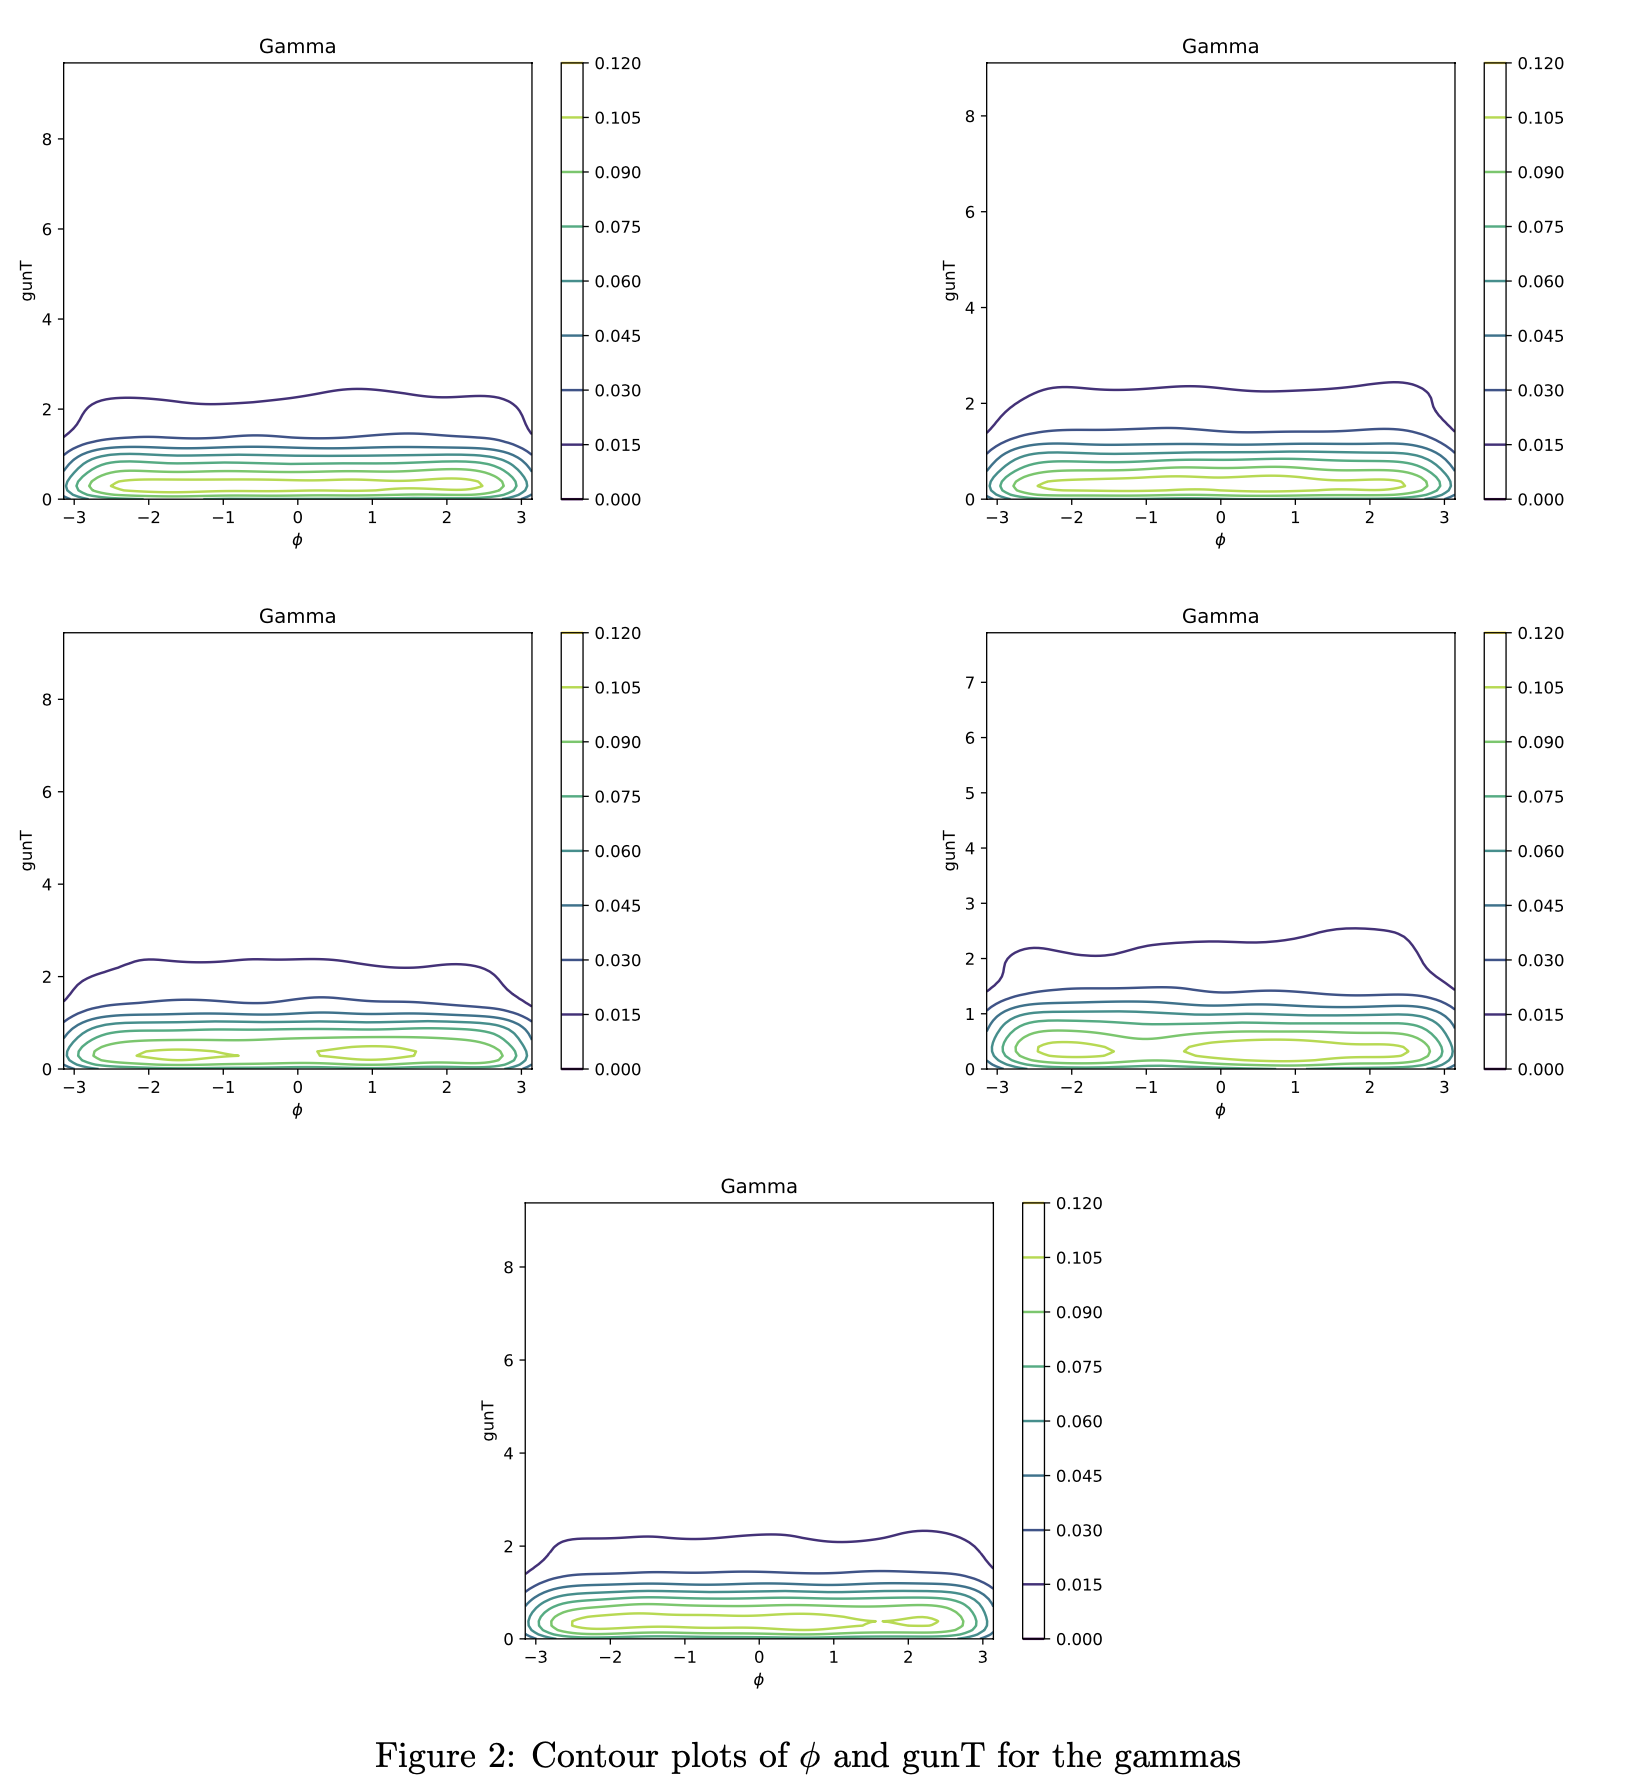
The φ distribution for gammas seems to be uniform in the plots below.
Below follows contour plots for cos(θ) against gunT for neutrons. As expected from the energy distribution histogrrams most of the neutrons are around gunT ~40 MeV and note that the x-axis values vary very little which means neutrons are emitted at roughly the same angle cos(θ) = [0.95, 1] -→ θ ~ 0 deg
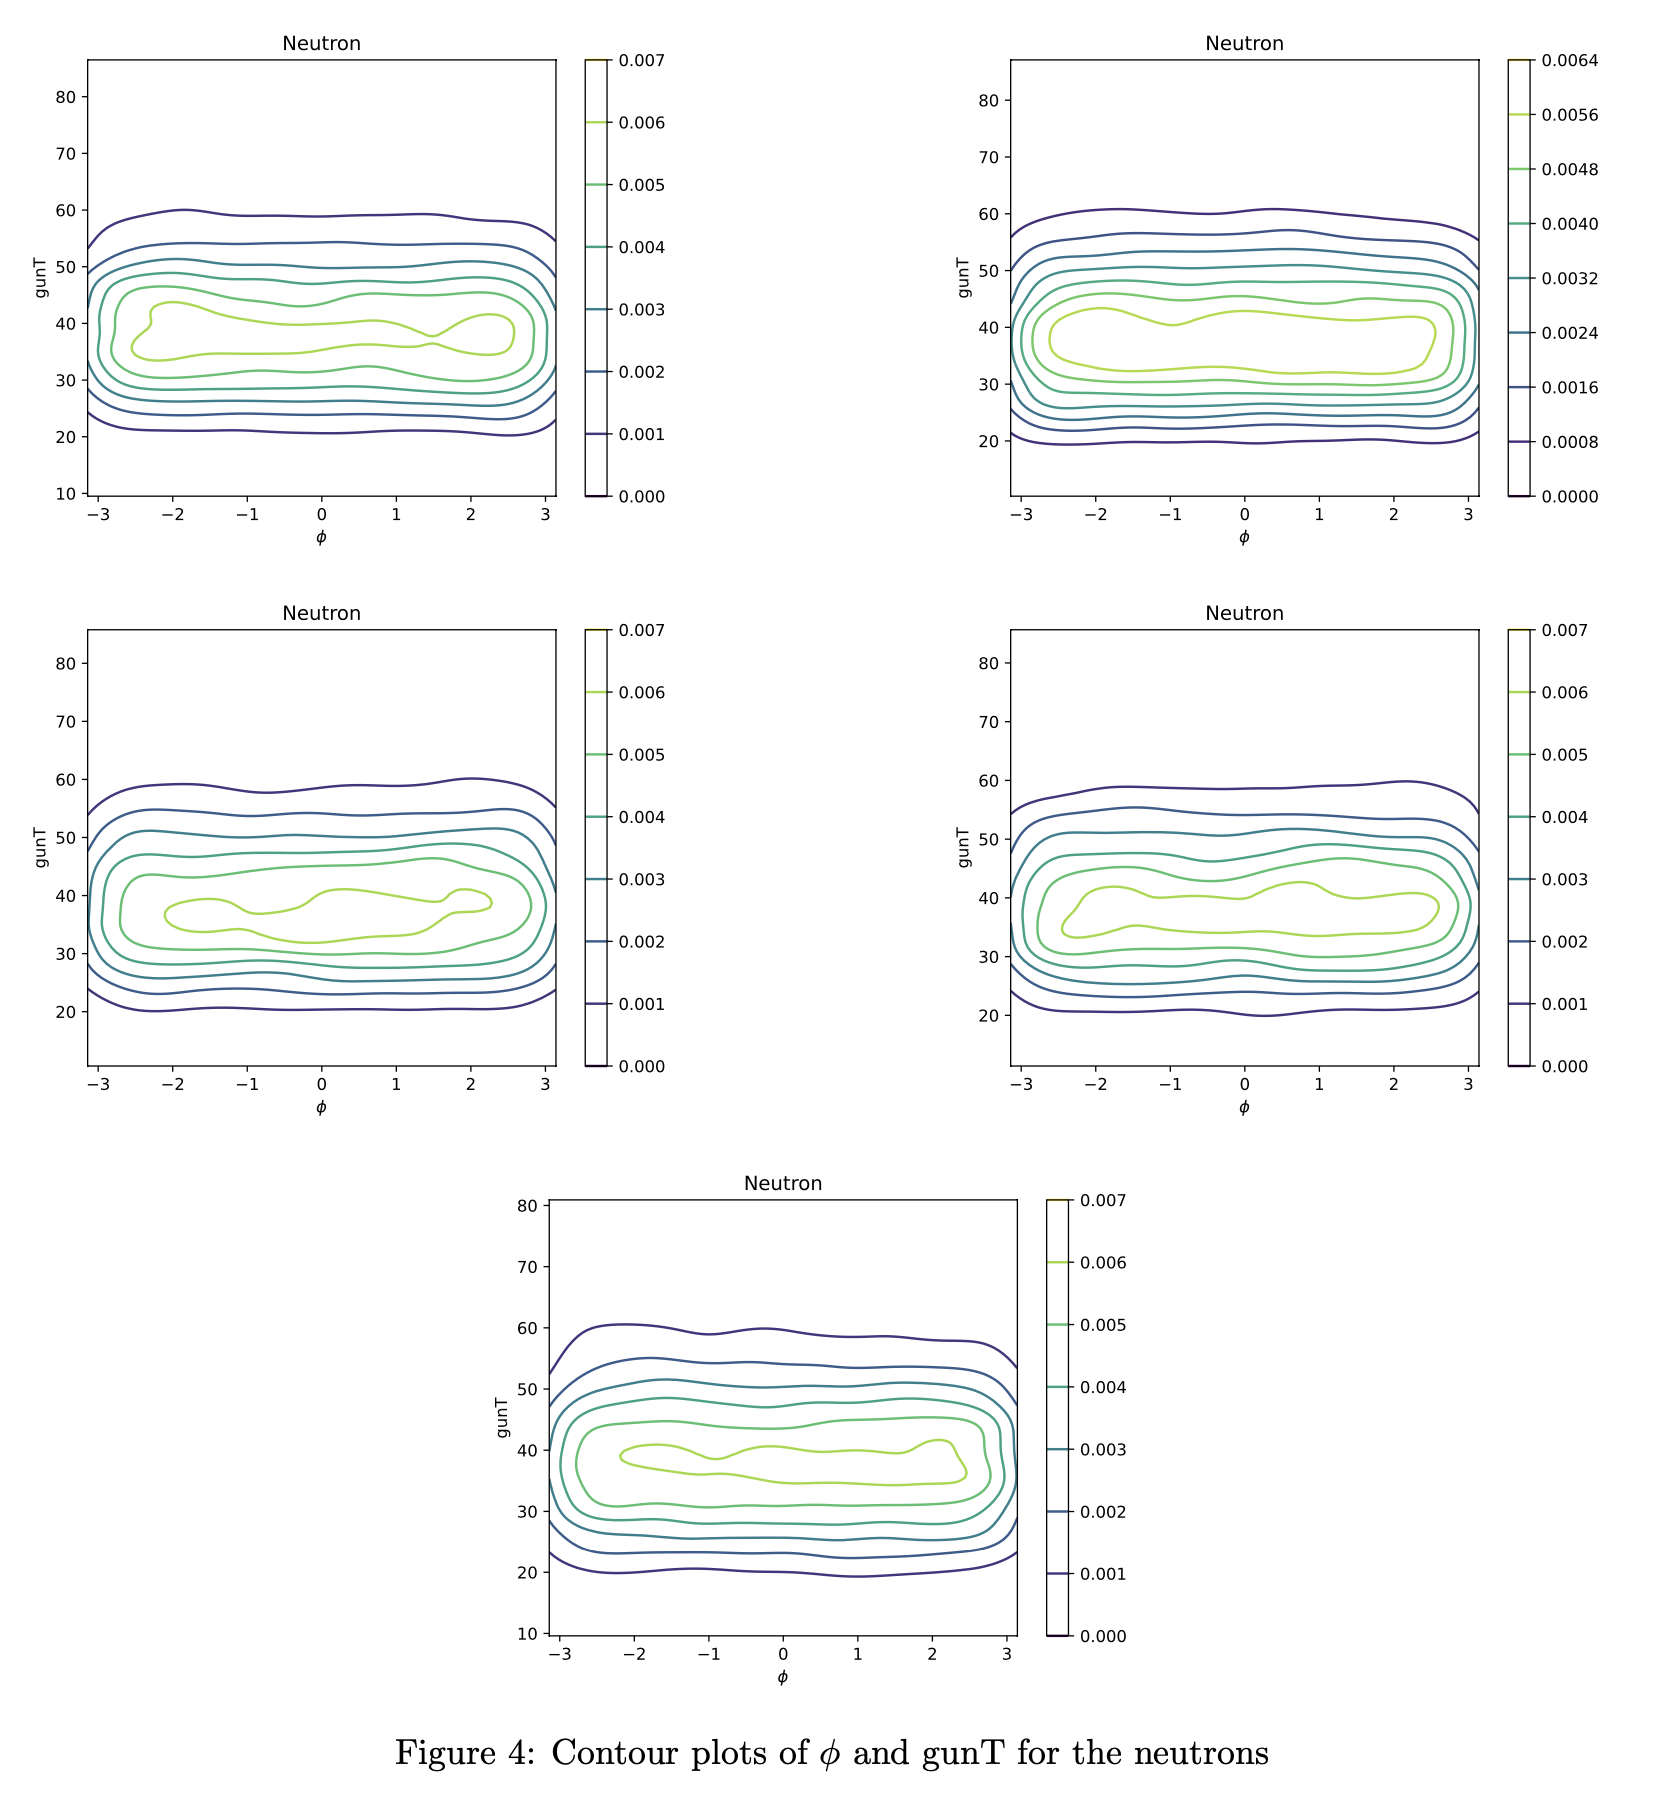
The φ distribution for neutrons seems to be uniform in the plots below.
Edit | Attach | Print version | History: r3 < r2 < r1 | Backlinks | View wiki text | Edit wiki text | More topic actions
Topic revision: r3 - 21 Dec 2023, AnnaKawecka
- This page was cached on 17 Jun 2026 - 06:06.
Ideas, requests, problems regarding Foswiki? Send feedback