You are here: Foswiki>SubExp_Chalmers Web>TelescopeDetector (21 Jan 2024, GabrielShafiqAhlgren)Edit Attach
-- GabrielShafiqAhlgren - 07 Jan 2024
Plots and Investigations Relating to
A ΔE-E-telescope detector is a detector used to identify charged particles. It consists of two
layers; a thin ΔE-layer and a thicker E-layer, connected in series. The deposited energy in each layer
can be used to identify particle type by determining the charge, mass and kinetic energy of incident
particles. How Many Fission Fragments Make It
On average, about 39.0% of all fragments that reach the ΔE-layer pass through it and reach the E-layer.
Simultaneously, about 99.8% of all created fragments reach the ΔE-layer. From figure 1 it is clear that the amount of fragments that pass through the ΔE-layer is independent of
excitation energy, at least within a reasonable interval given the experiment (6 to 10 MeV). This is not
the case for distance, which affects both the number of fragments that hit the ΔE-layer and also eventually
reaches the E-layer. Figure 2 illustrates this dependence.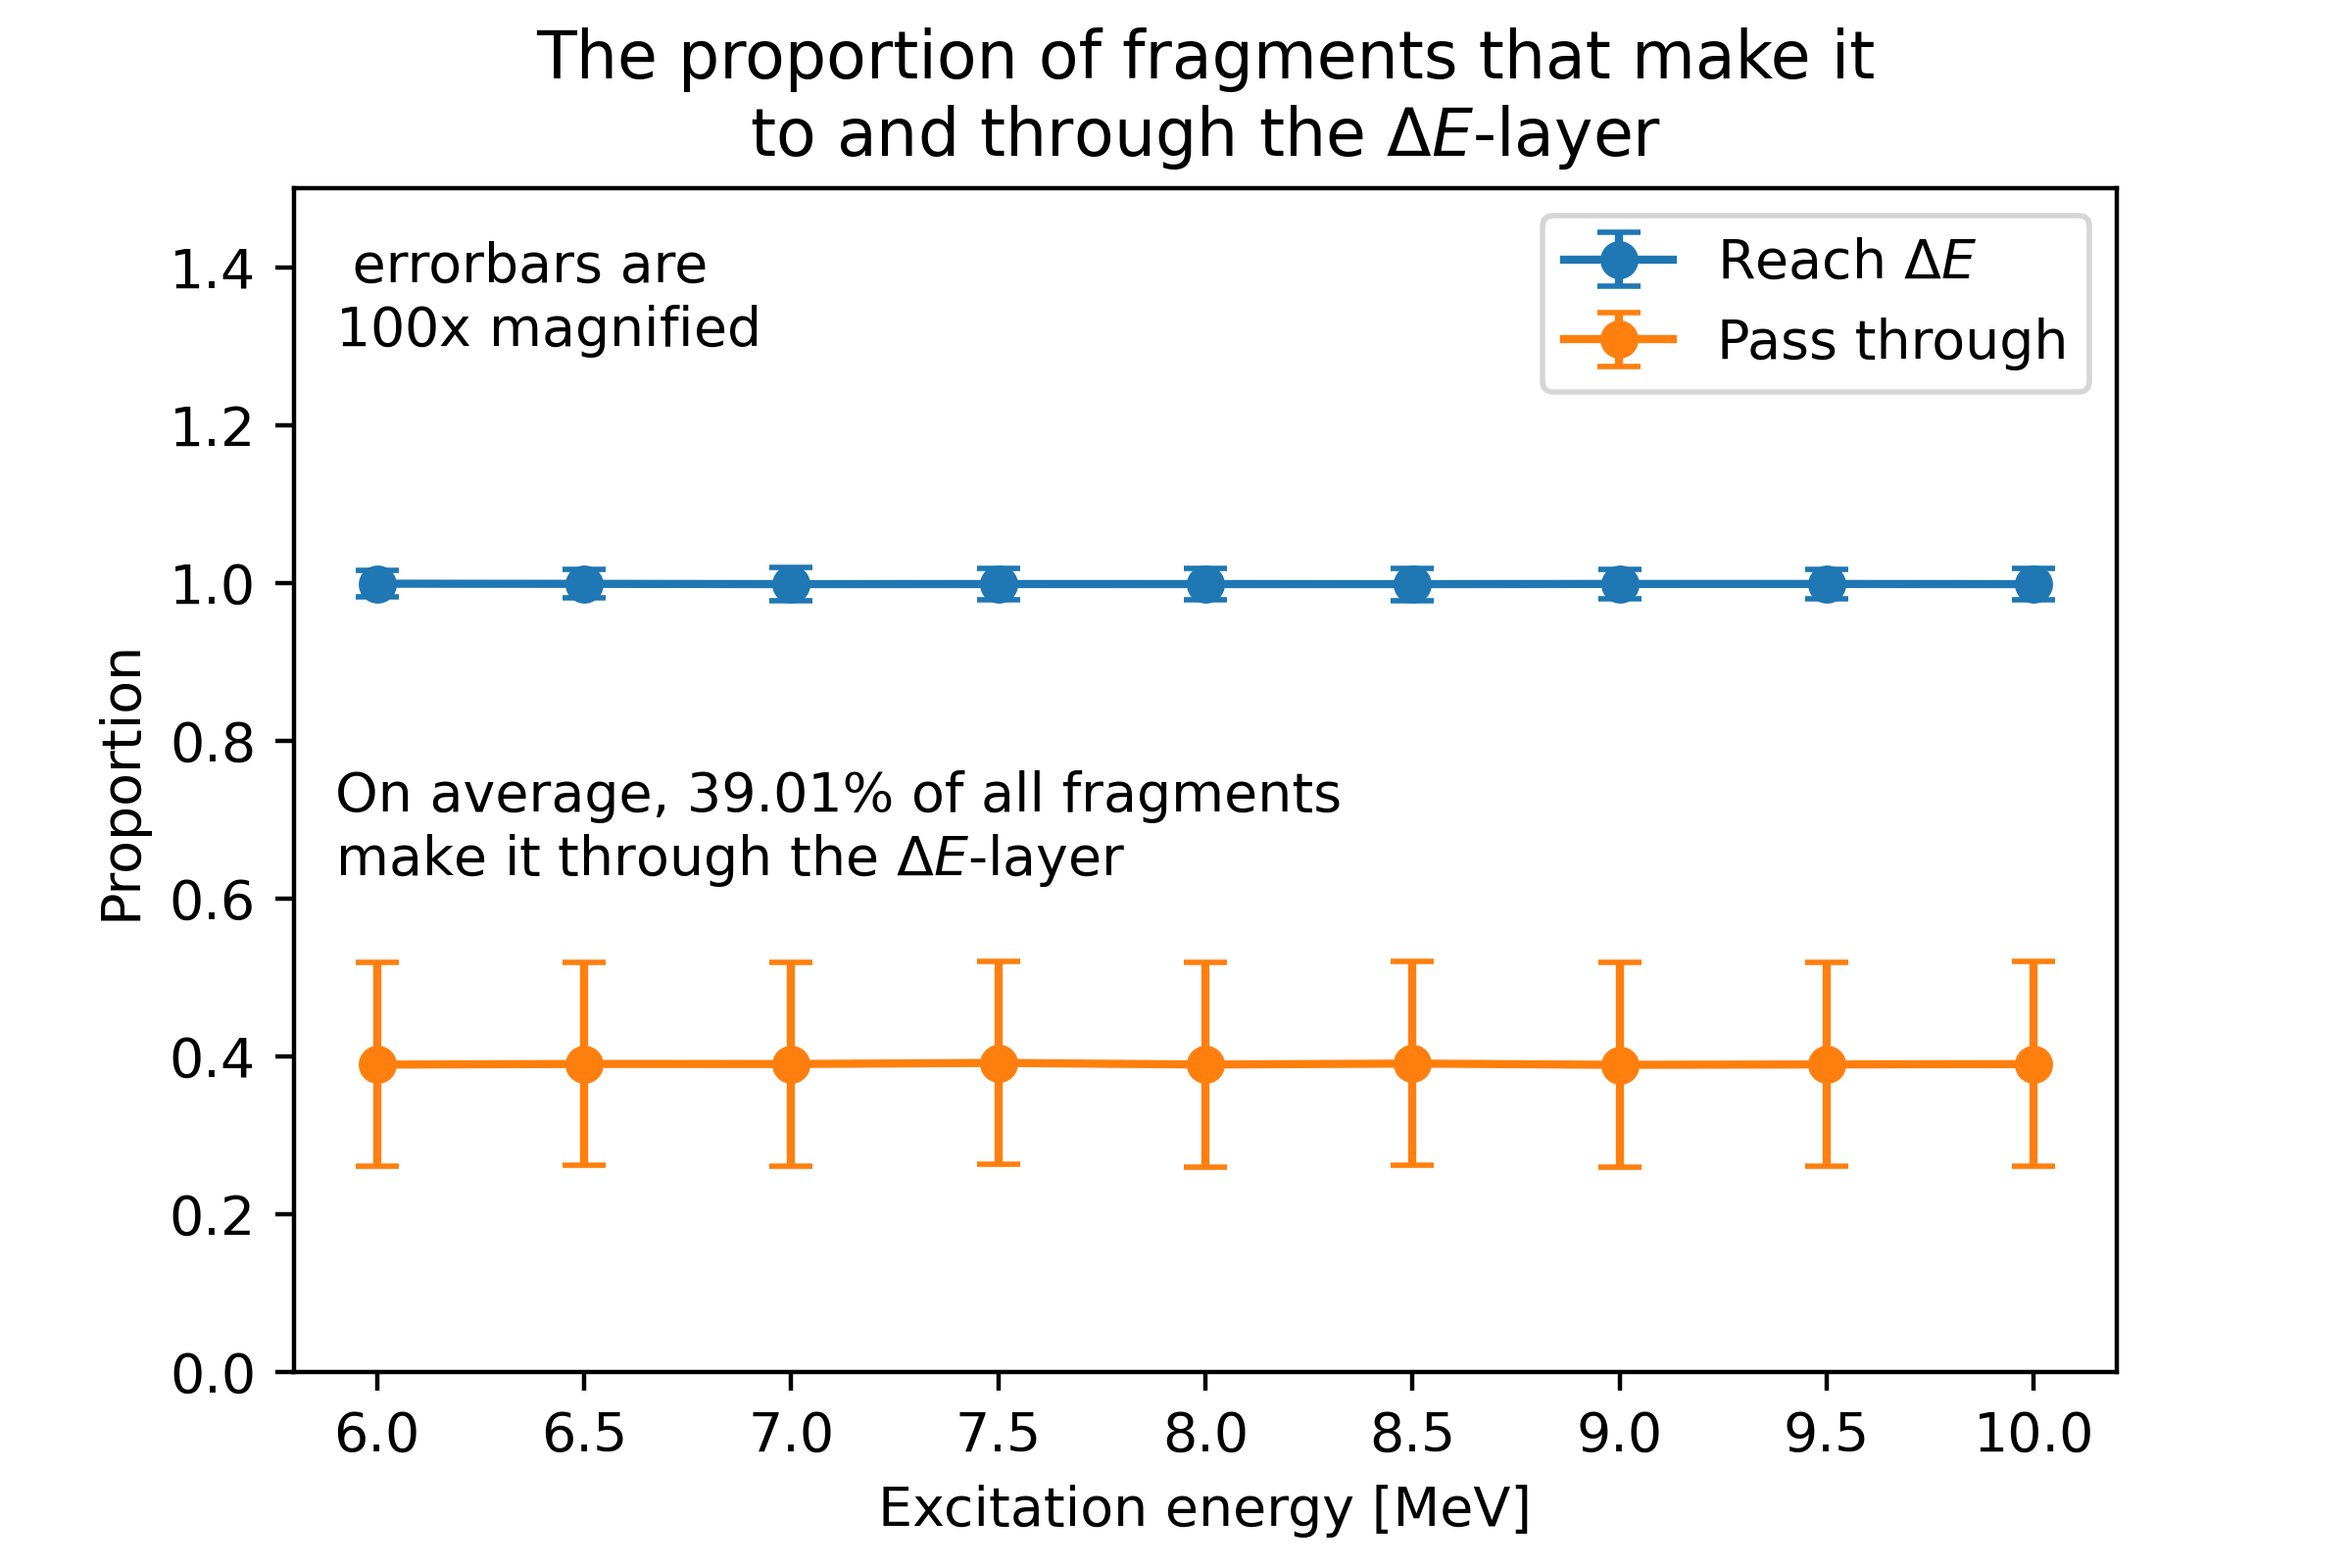 Figure 1: The proportion of all fragments that reach the ΔE-layer and the proportion
of those fragments that pass through the ΔE-layer and hit the E-layer for different
excitation energies. Each observation is based on 10^5 events. Error bars represent
a 95% confidence interval of the mean and are magnified by a factor of 100 in the figure.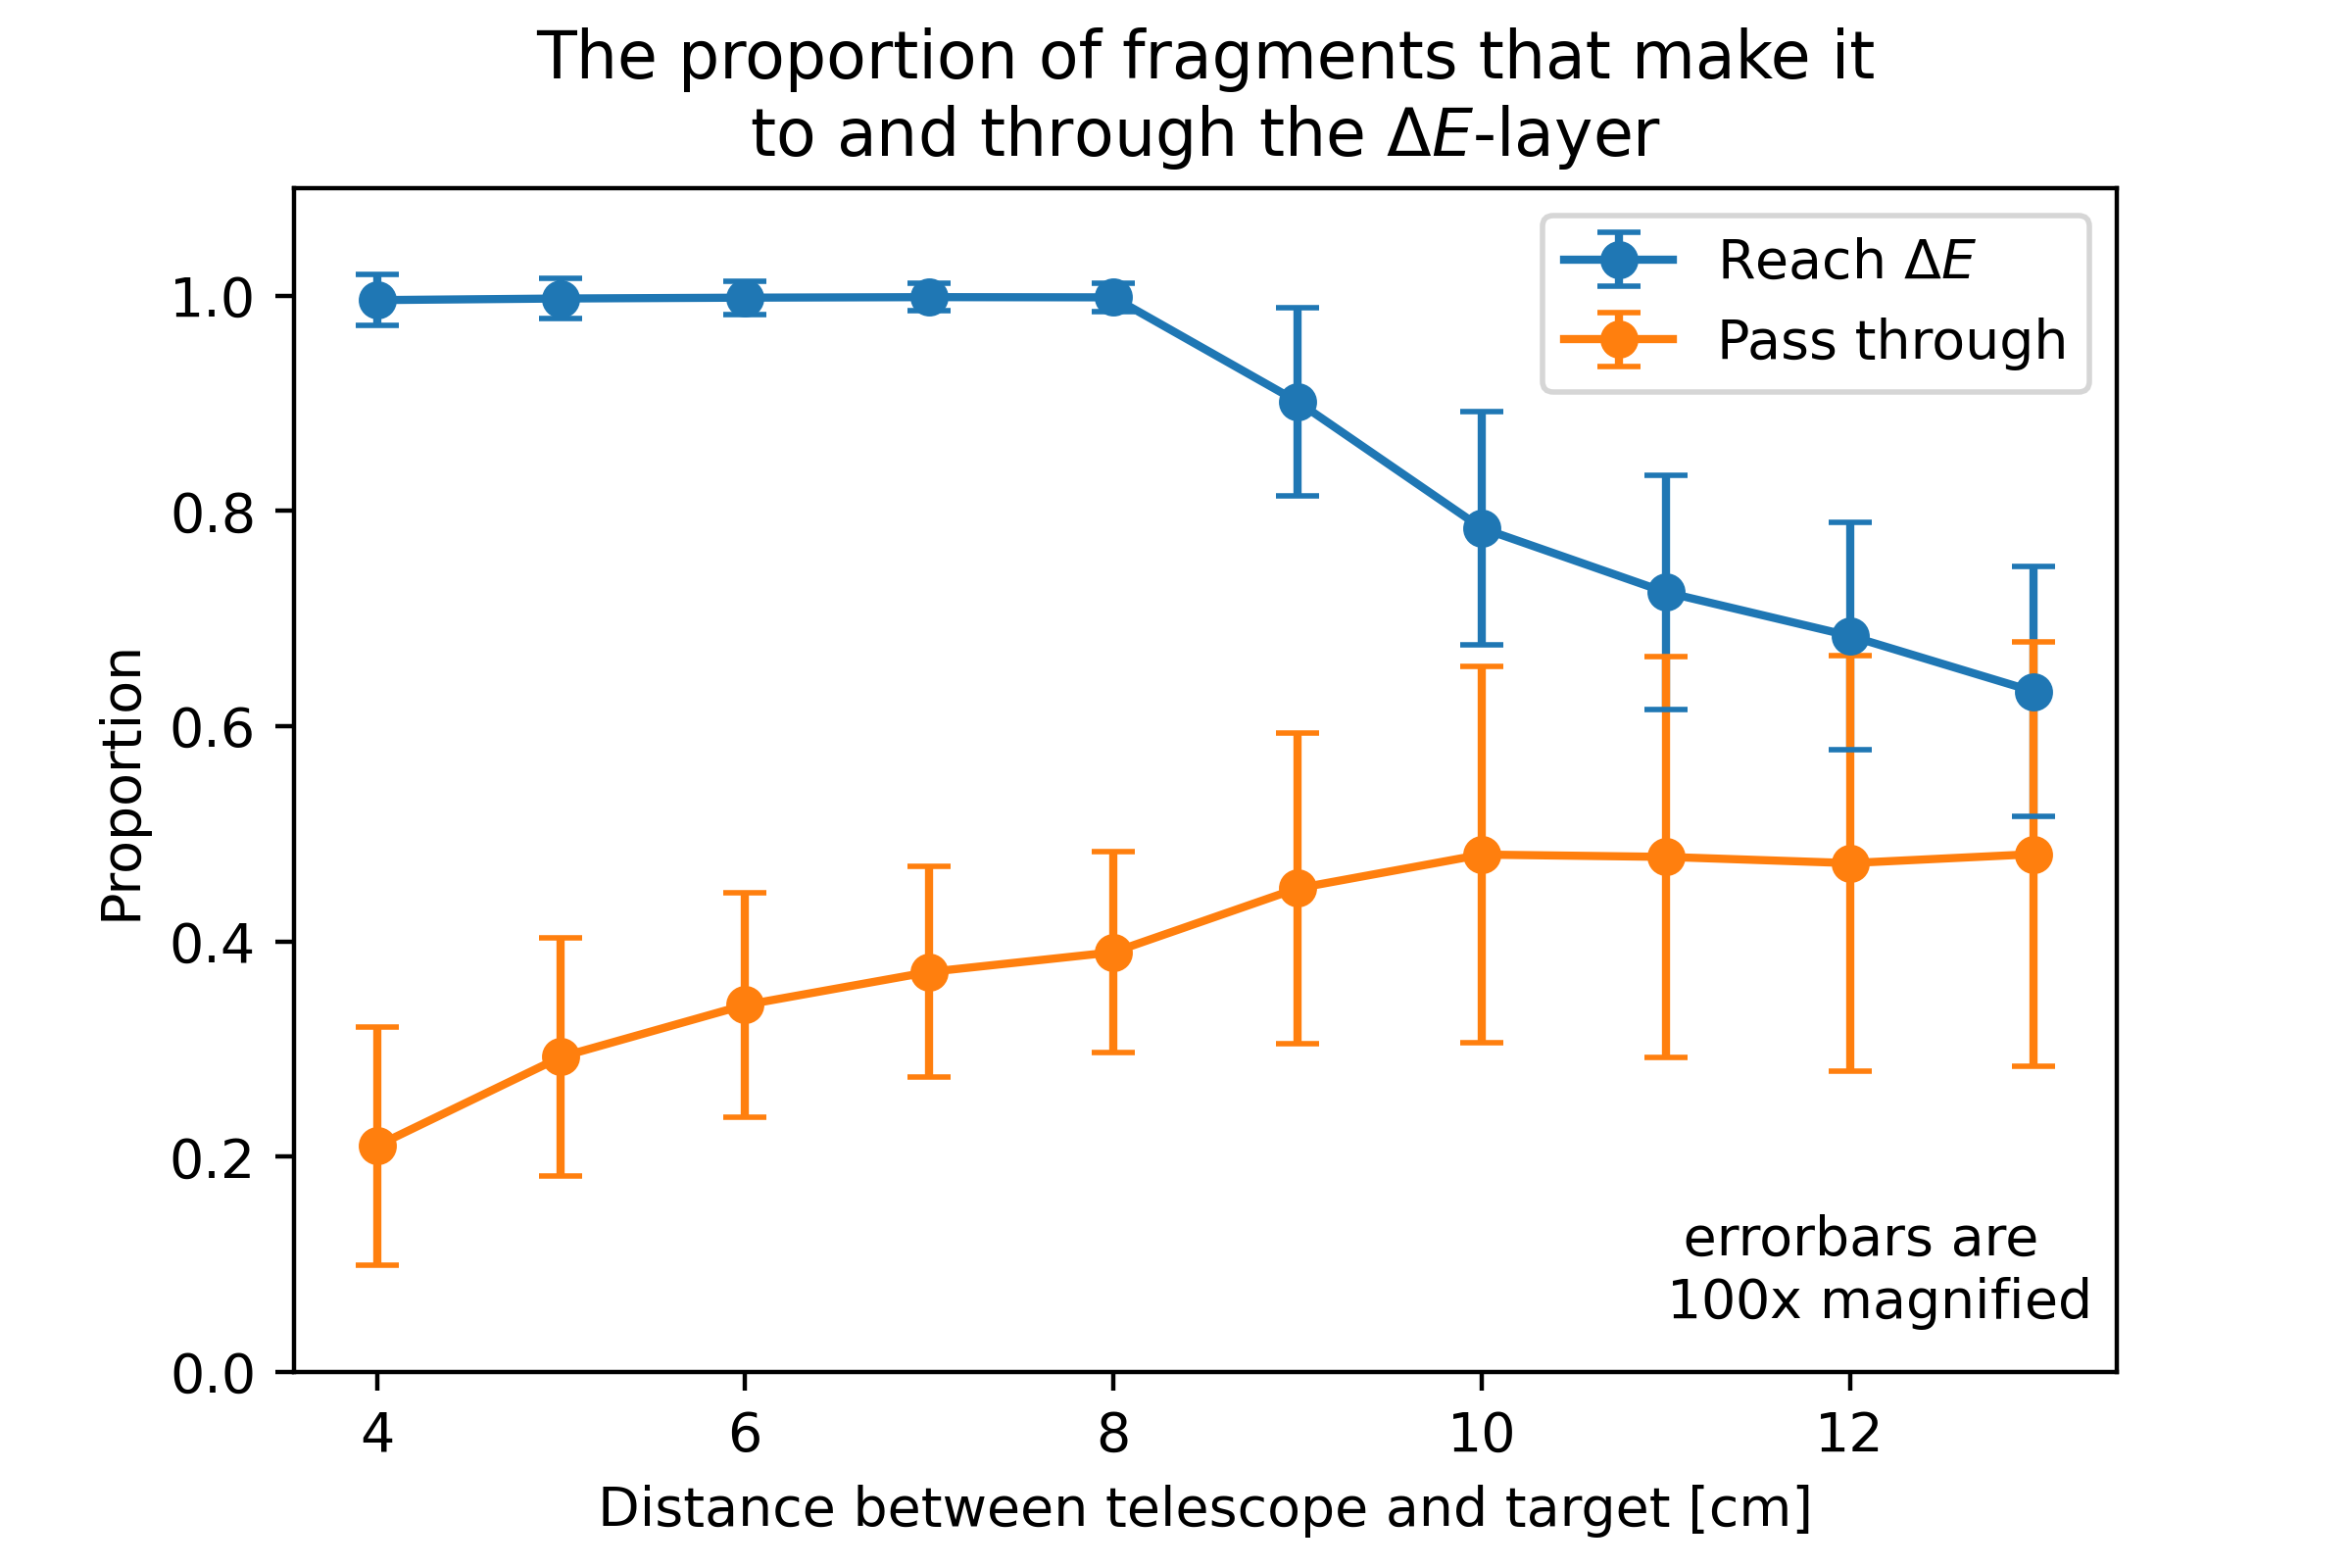 Figure 2: The proportion of all fragments that reach the ΔE-layer and the proportion
of those fragments that pass through the ΔE-layer and hit the E-layer for different
distances between target and telescope. Each observation is based on 10^5 events.
Error bars represent a 95% confidence interval of the mean and are magnified by a factor
of 100 in the figure.
simulation. Figure 3 and 4 therefore shows particle histograms for both layers of the
detector.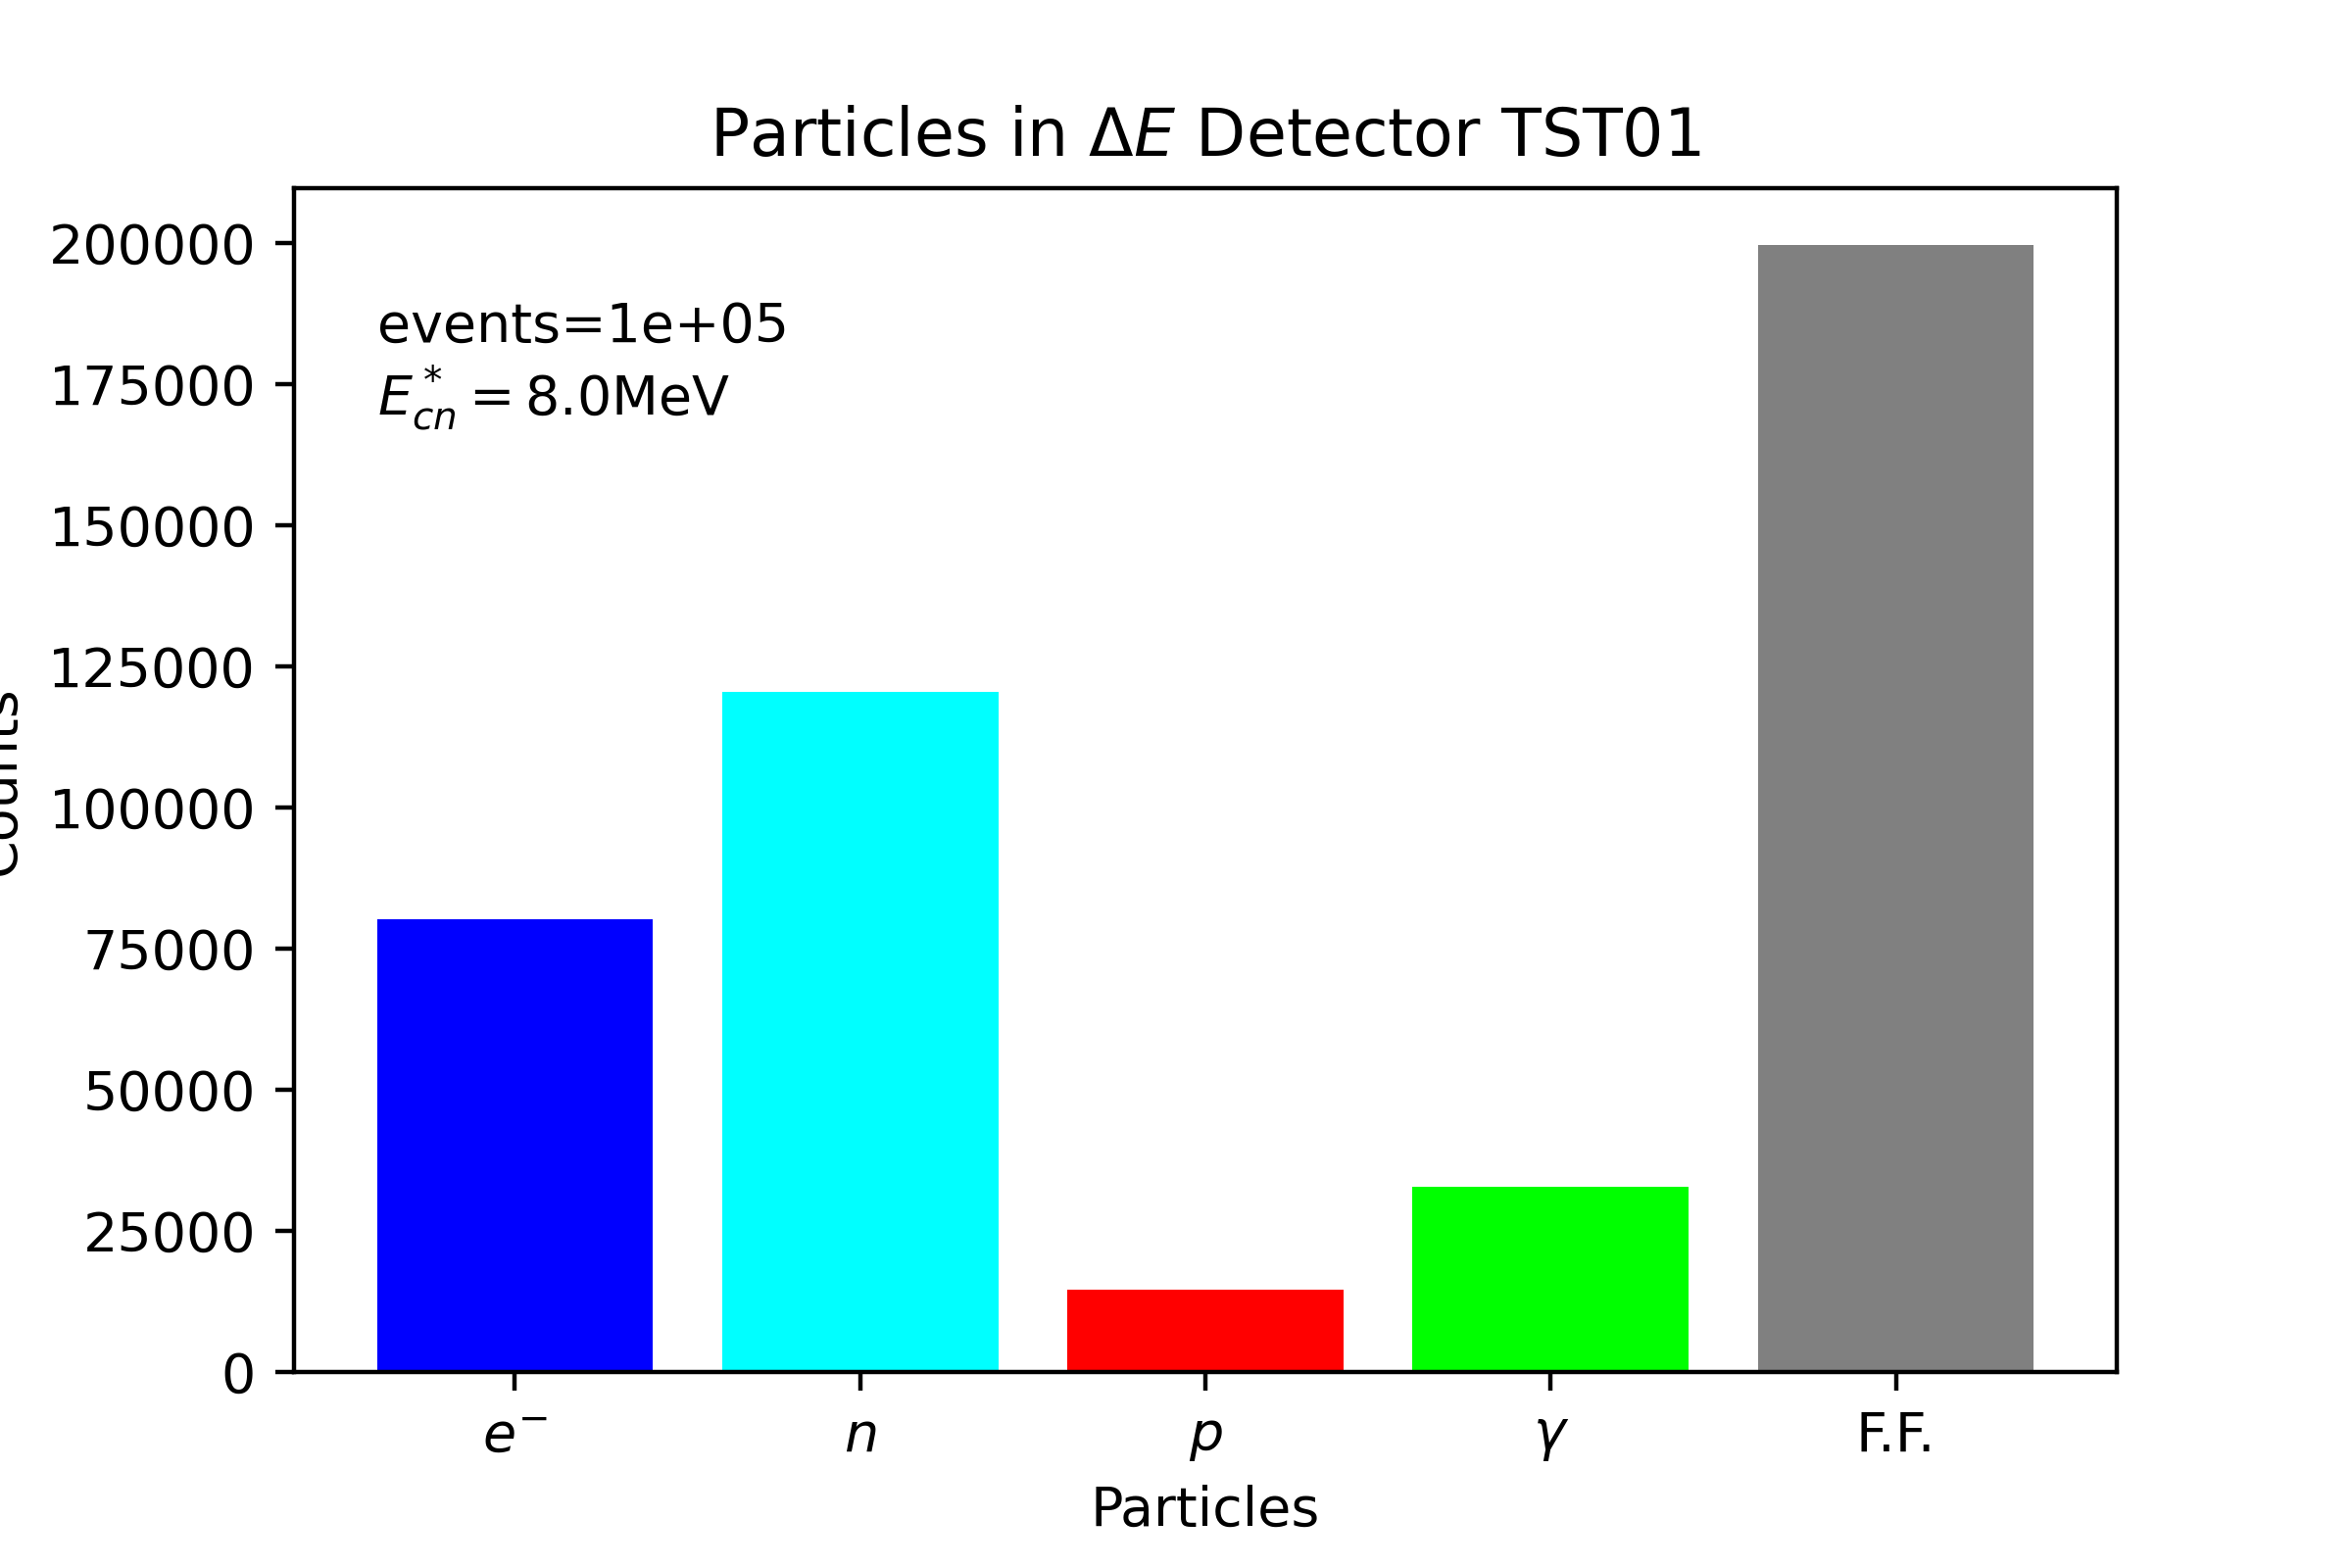 Figure 3: A histogram of all particles that entered the ΔE-layer.
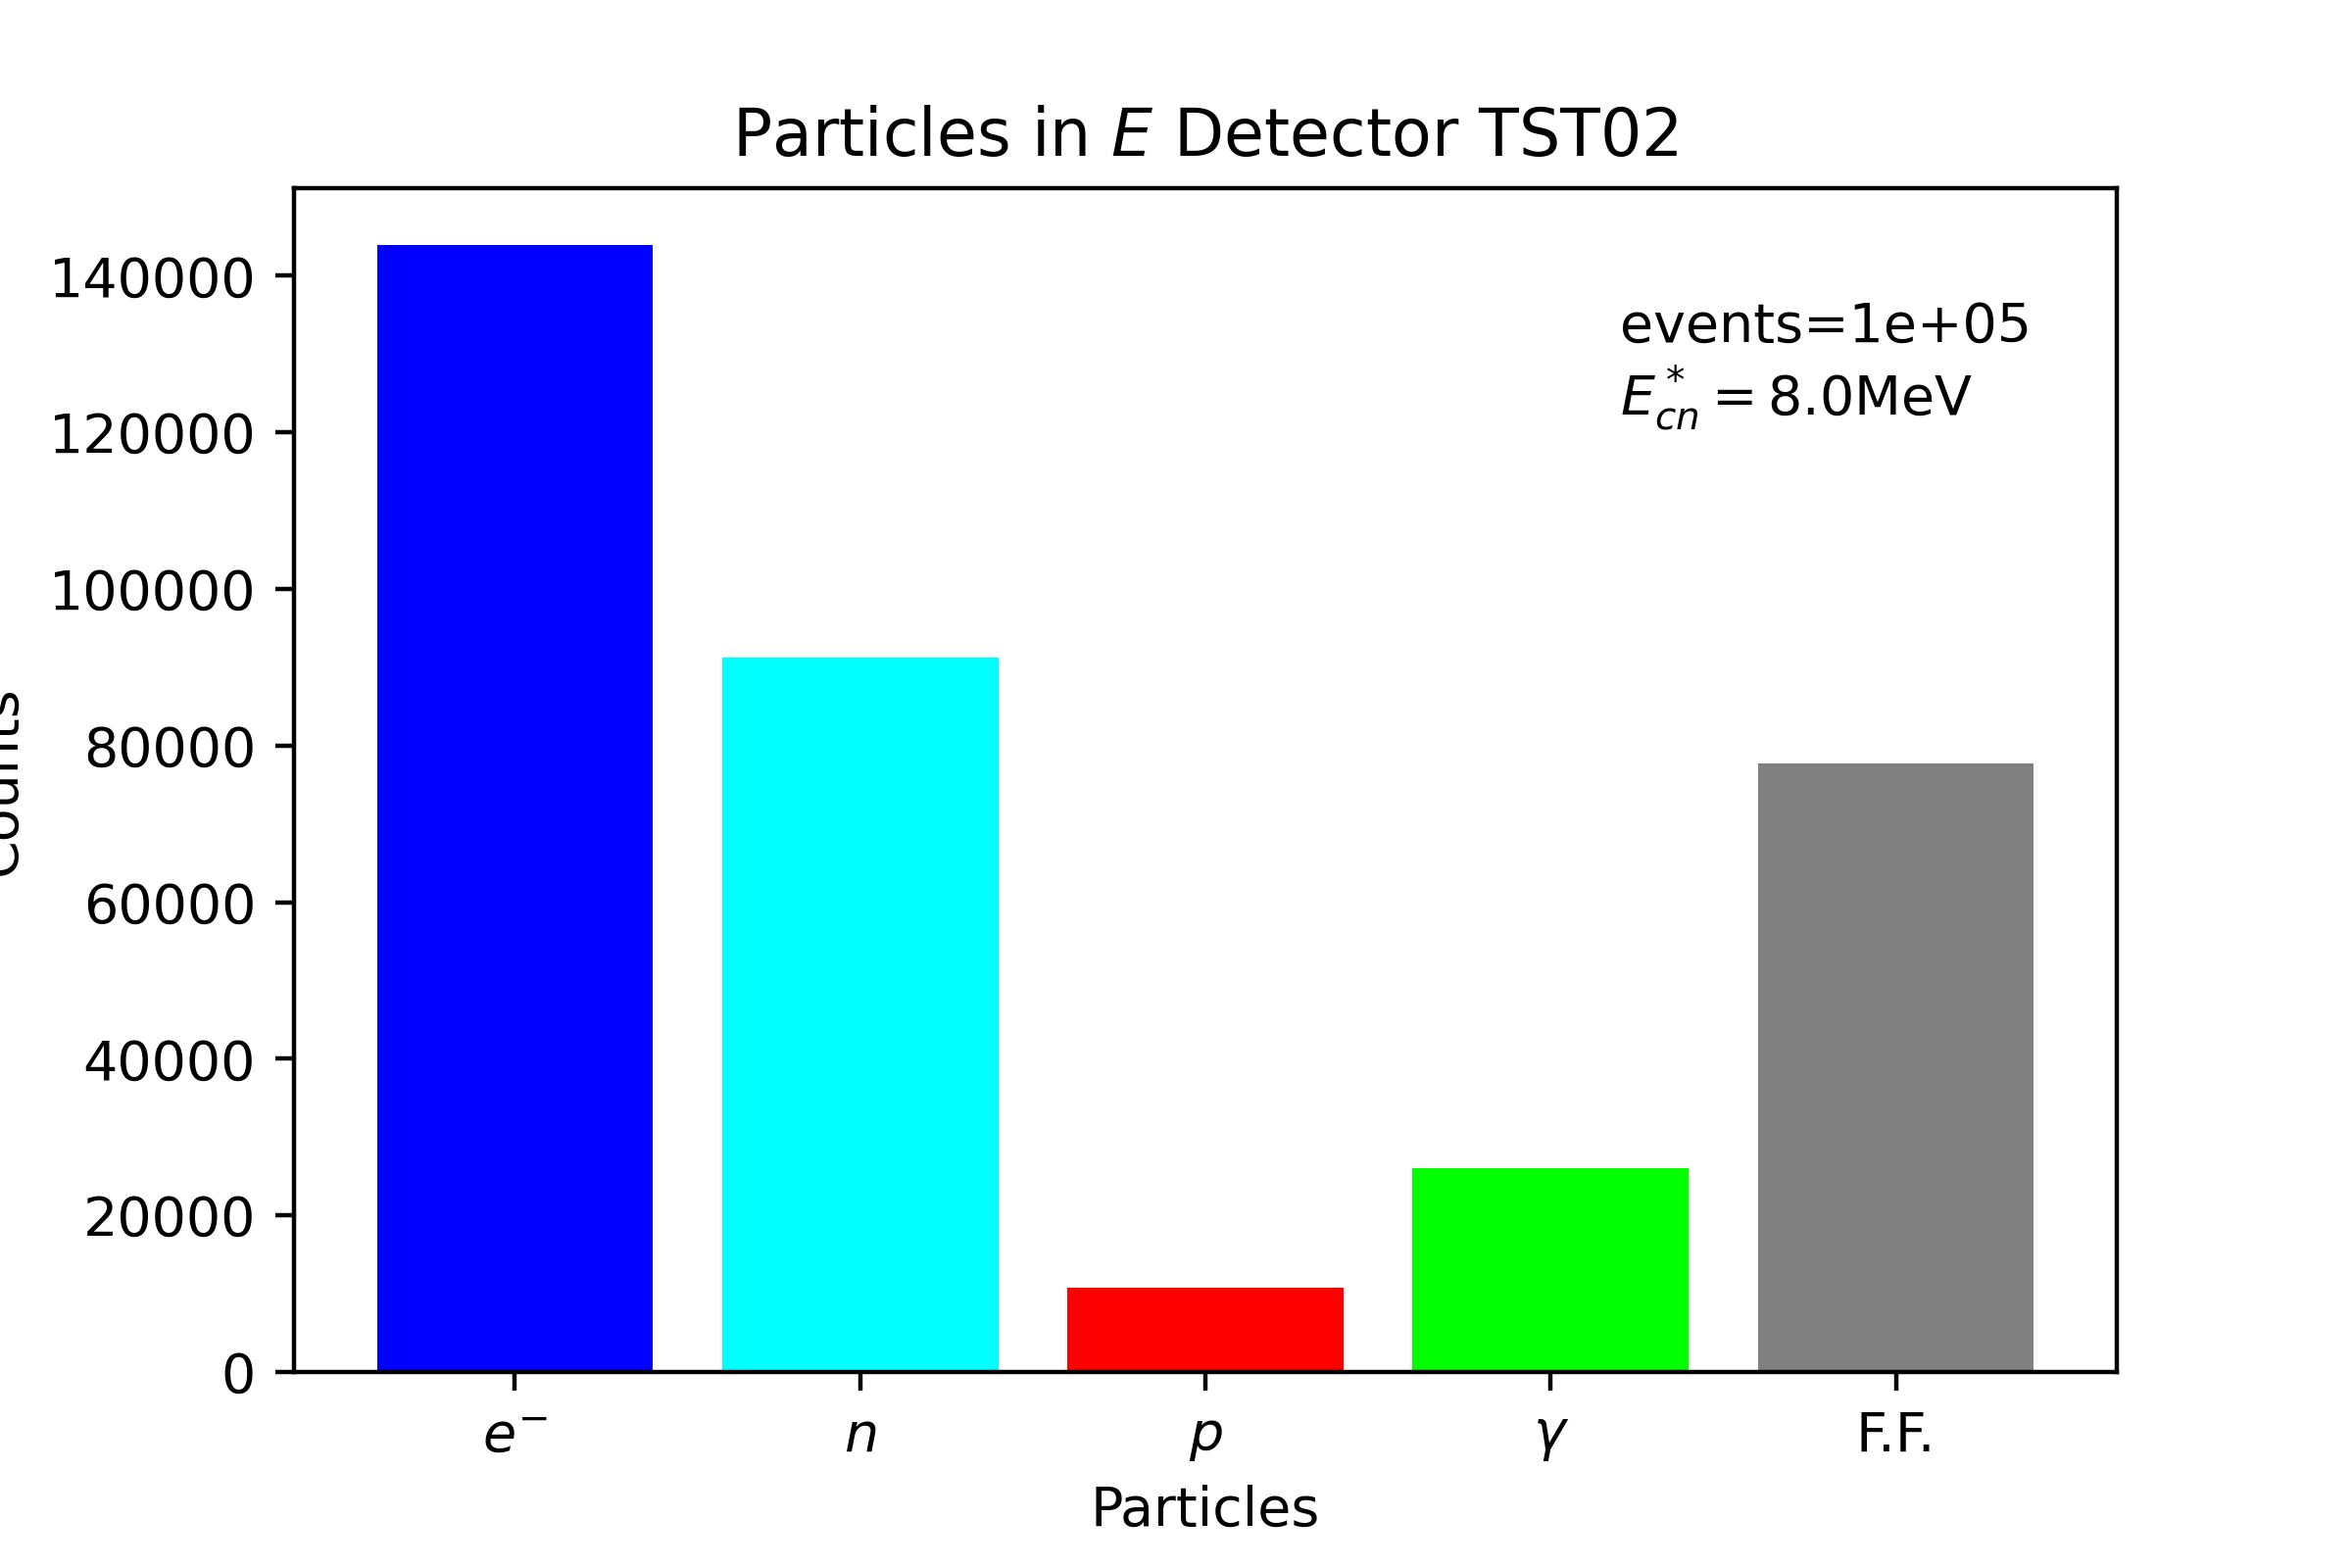 Figure 4: A histogram of all particles that entered the E-layer.
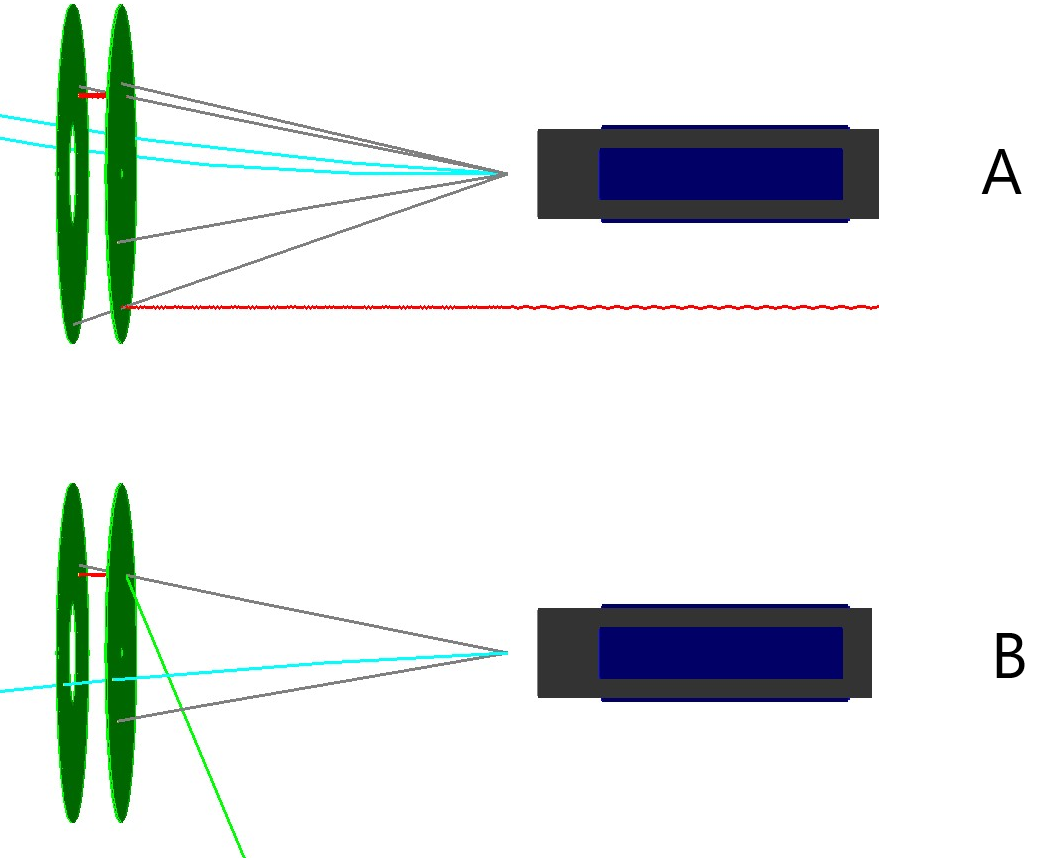 Figure 5: Trajectories plotted in GEANT4. The colors represent:
gray -- fission fragment, cyan -- proton, red -- electron, green -- gamma.
A: Two fission events that both produce electrons in opposite directions
from the interaction of a fission fragment with the ΔE-layer.
B: One fission event that produces a photon and an electron from the
same interaction.
Plots and Investigations Relating to
the dE-E Telescope Detector
A ΔE-E-telescope detector is a detector used to identify charged particles. It consists of two layers; a thin ΔE-layer and a thicker E-layer, connected in series. The deposited energy in each layer
can be used to identify particle type by determining the charge, mass and kinetic energy of incident
particles.
How Many Fission Fragments Make It
Through the ΔE-layer
On average, about 39.0% of all fragments that reach the ΔE-layer pass through it and reach the E-layer.Simultaneously, about 99.8% of all created fragments reach the ΔE-layer. From figure 1 it is clear that the amount of fragments that pass through the ΔE-layer is independent of
excitation energy, at least within a reasonable interval given the experiment (6 to 10 MeV). This is not
the case for distance, which affects both the number of fragments that hit the ΔE-layer and also eventually
reaches the E-layer. Figure 2 illustrates this dependence.
 Figure 1: The proportion of all fragments that reach the ΔE-layer and the proportion
of those fragments that pass through the ΔE-layer and hit the E-layer for different
excitation energies. Each observation is based on 10^5 events. Error bars represent
a 95% confidence interval of the mean and are magnified by a factor of 100 in the figure.
 Figure 2: The proportion of all fragments that reach the ΔE-layer and the proportion
 of those fragments that pass through the ΔE-layer and hit the E-layer for different
distances between target and telescope. Each observation is based on 10^5 events.
Error bars represent a 95% confidence interval of the mean and are magnified by a factor
of 100 in the figure.
Particles That Hit the Detector
In the simulation one can also look at which particles hit the telescope detector in thesimulation. Figure 3 and 4 therefore shows particle histograms for both layers of the
detector.
 Figure 3: A histogram of all particles that entered the ΔE-layer.
 Figure 4: A histogram of all particles that entered the E-layer.
 Figure 5: Trajectories plotted in GEANT4. The colors represent:
gray -- fission fragment, cyan -- proton, red -- electron, green -- gamma.
A: Two fission events that both produce electrons in opposite directions
from the interaction of a fission fragment with the ΔE-layer.
B: One fission event that produces a photon and an electron from the
same interaction.
Edit | Attach | Print version | History: r4 < r3 < r2 < r1 | Backlinks | View wiki text | Edit wiki text | More topic actions
Topic revision: r4 - 21 Jan 2024, GabrielShafiqAhlgren
 Copyright © by the contributing authors. All material on this collaboration platform is the property of the contributing authors.
 Ideas, requests, problems regarding Foswiki? Send feedback
