You are here: Foswiki>SubExp_Chalmers Web>AnglesKinetic (09 Jan 2024, AliceSvärdström)Edit Attach
-- AliceSvärdström - 08 Jan 2024
--test-13=dz=0.01cm,z0=-2.068cm,r=1.2cm,type=blackhole,enter,tree=1 \
--gun=d,dummy,T=0MeV,setboost,feed=target \
--gun=from=target,Ac229,dummy,T/u=8MeV/u,addboost,feed=cm \
-- gun=from=cm,p,Ac230:dummy:feed:setboost,Eexc=${Ex}MeV,isotropic,recoil,phasespace,feed=compound \
--gun-file=maxparticles=80,../ gunfiles / gun_230Ac_$ {Ex} MeV.txt,from=compound,boost \
--world=type=vacuum \
--fieldbox=d=200cm,Bz=2T \
--events=100000 \
--tree=helioscylinder${DIST}cm_${Ex}Mev.root The distance between array and target has been set to z0 = −2.068 cm, a 100000 events have been simulated for excitation energies Ex ∈ [6, 10] MeV for the nucleus and the proton-detection rates can be found in Table 1 below (same statistics as in Angles of protons emitted).
Table 1: Detection ratio of protons that hit the Si-array for different excitation energies.
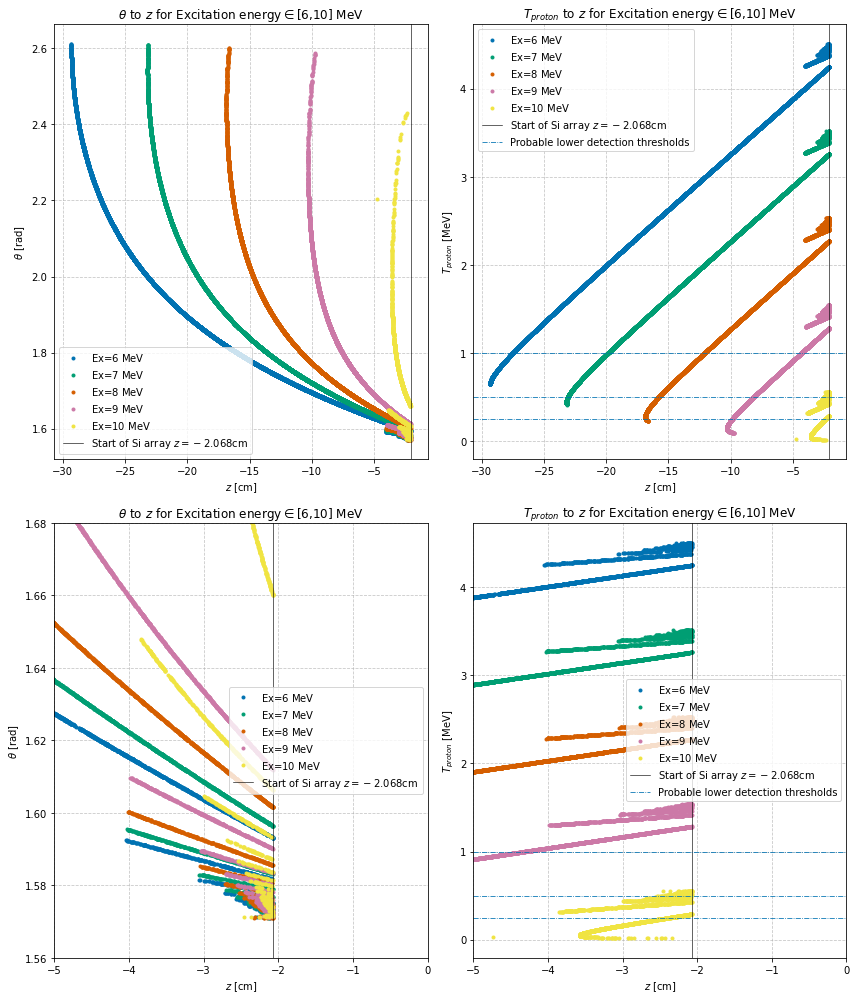
In figure 1, θ and Tproton are plotted against the z-values of every hit for each of the excitation energies, showing full plots in the upper panel and zoomed-in versions of the same plots around the z-coordinate of the beginning of the array in the lower. Keep in mind that lower values on the z-axis correspond to hits further down on the array because the target is placed at z = 0. Notice that for both the θ and the Tproton plot we see things happening at the beginning of the array, shown in greater detail in the lower panel. These differences are assumed to be multiturn events, and imply that those events tend to hit the beginning of the array. Notice also that if we expect to be able to detect protons with a kinetic energy of up to 9 MeV but not lower than either 1, 0.5 or 0.25 MeV, which are all possible lower detection thresholds, events corresponding to excitation energy 10 MeV might not be detected.
 Figure 1: θ and Tproton plotted against the z-values of every hit for each of the excitation energies, showing full plots in the upper panel and zoomed-in versions of the same plots around the z-coordinate of the beginning of the array in the lower. Vertical black line corresponds to the starting point in z of the Si array and the horisontal blue dashed lines shows possible lower detection thresholds for the kinetic energy of the protons during the experiment.
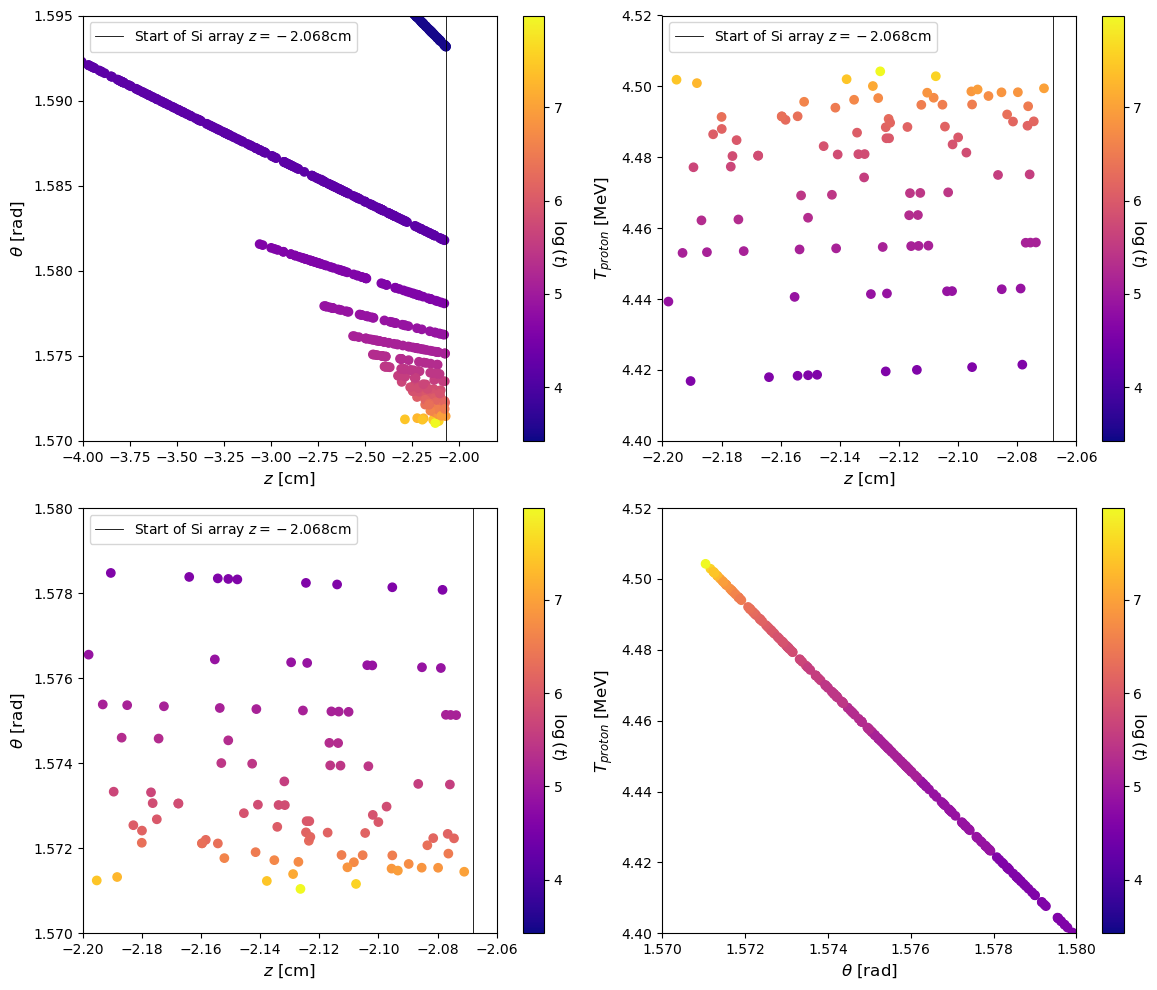
Figure 2 shows zoomed-in scatterplots of θ(z) and Tproton(z) for the case Ex=6 MeV but now with an added color grading based on log(t), which is the logaritm of the time-of-flight for the proton. These results further points to the detection of multiturn events due to hits at a similar z-value corresponds to a wide range of times. See Si-array multi-turn plots for more detailed results on multiturn events.
 Figure 2: Scatterplots showing θ(z) (top and bottom left), Tproton(z) (top left) and Tproton(θ) (bottom left) for the case Ex=6 MeV with a color grading based on log(t), which is the logaritm of the time-of-flight for the proton, given in nanoseconds.
In ggland the Si-detector has been simulated as a mimic-cylinder (test-01) and a ”black hole''-screen (test-13) that excludes hits at the front and inside of the mimic-cylinder with the following bash-script:
--test-01=dz=37.465cm,z0=-20.8cm,ir=0.8cm,r=1.2cm,type=Si,enter,tree=1 \--test-13=dz=0.01cm,z0=-2.068cm,r=1.2cm,type=blackhole,enter,tree=1 \
--gun=d,dummy,T=0MeV,setboost,feed=target \
--gun=from=target,Ac229,dummy,T/u=8MeV/u,addboost,feed=cm \
-- gun=from=cm,p,Ac230:dummy:feed:setboost,Eexc=${Ex}MeV,isotropic,recoil,phasespace,feed=compound \
--gun-file=maxparticles=80,../ gunfiles / gun_230Ac_$ {Ex} MeV.txt,from=compound,boost \
--world=type=vacuum \
--fieldbox=d=200cm,Bz=2T \
--events=100000 \
--tree=helioscylinder${DIST}cm_${Ex}Mev.root The distance between array and target has been set to z0 = −2.068 cm, a 100000 events have been simulated for excitation energies Ex ∈ [6, 10] MeV for the nucleus and the proton-detection rates can be found in Table 1 below (same statistics as in Angles of protons emitted).
| Excitation energy [MeV] | Detection Percentage |
|---|---|
| 6 | 27% |
| 7 | 23% |
| 8 | 19% |
| 9 | 13% |
| 10 | 5.1% |
 Figure 1: θ and Tproton plotted against the z-values of every hit for each of the excitation energies, showing full plots in the upper panel and zoomed-in versions of the same plots around the z-coordinate of the beginning of the array in the lower. Vertical black line corresponds to the starting point in z of the Si array and the horisontal blue dashed lines shows possible lower detection thresholds for the kinetic energy of the protons during the experiment.
Figure 2 shows zoomed-in scatterplots of θ(z) and Tproton(z) for the case Ex=6 MeV but now with an added color grading based on log(t), which is the logaritm of the time-of-flight for the proton. These results further points to the detection of multiturn events due to hits at a similar z-value corresponds to a wide range of times. See Si-array multi-turn plots for more detailed results on multiturn events.
 Figure 2: Scatterplots showing θ(z) (top and bottom left), Tproton(z) (top left) and Tproton(θ) (bottom left) for the case Ex=6 MeV with a color grading based on log(t), which is the logaritm of the time-of-flight for the proton, given in nanoseconds.
Edit | Attach | Print version | History: r3 < r2 < r1 | Backlinks | View wiki text | Edit wiki text | More topic actions
Topic revision: r3 - 09 Jan 2024, AliceSvärdström
 Copyright © by the contributing authors. All material on this collaboration platform is the property of the contributing authors.
 Ideas, requests, problems regarding Foswiki? Send feedback
